WTI OIL Analysis: EIA Predicts Lower Oil Prices
In this comprehensive analysis, Ultima Markets brings you an insightful breakdown of the WTI OIL for June 11, 2025.
Fundamental Analysis of WTI OIL
WTI OIL Key Takeaways
- Crude oil production will decline: According to the Short-Term Energy Outlook released by the U.S. Energy Information Administration (EIA), the agency expects U.S. crude oil production to decline in the next 18 months as falling oil prices lead producers to reduce drilling activities.
- Supply and demand imbalance: EIA pointed out that the slowdown in global oil demand growth, coupled with production growth in OPEC+ member countries and non-OPEC countries, makes it expected that global crude oil production will exceed consumption during the forecast period, driving up global crude oil inventories and exerting downward pressure on oil prices.
- EIA forecast price: In terms of crude oil price forecast, EIA expects oil prices to continue to fall as global inventories increase. International benchmark Brent crude oil is expected to fall from $64 per barrel in May to $61 at the end of the year and average $59/barrel in 2026. WTI crude oil is expected to fall to $57/barrel in the fourth quarter of this year and average $56/barrel in 2026.
Technical Analysis of WTI OIL
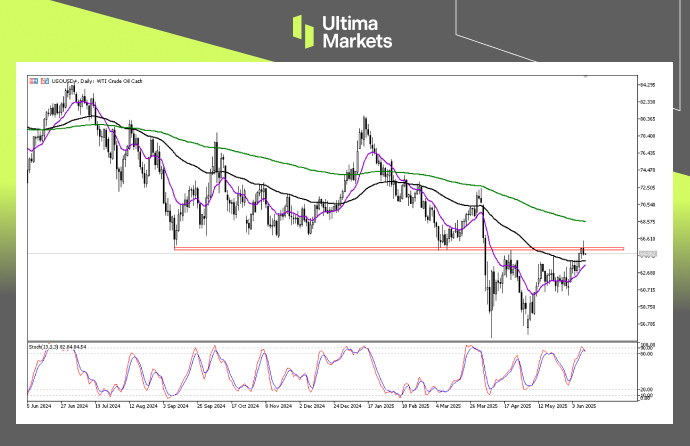
WTI OIL Daily Chart Insights

- Stochastic oscillator: The %K line (blue) has fallen from the overbought area (above 80) and crossed the %D line (red), forming a bearish death cross signal. Both lines are currently running downward in the upper and middle areas. This indicates that the upward momentum of the market has weakened in the short term, and there may be a certain demand for correction or consolidation.
- Horizontal resistance band: The red area marked in the figure (approximately $65.00 – $65.80) was an important support platform from September 2024 to February 2025. After being broken in March, it has now turned into a strong resistance area.
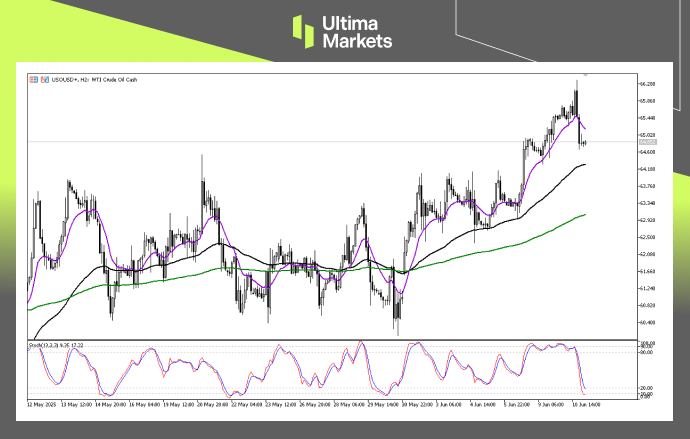
WTI OIL 2-hour Chart Analysis

- Stochastic oscillator: The stochastic indicator at the bottom shows that both the %K line (blue) and the %D line (red) have fallen sharply from the overbought area and have penetrated into the oversold area below 20. At present, the two lines are glued together at the bottom of the oversold area, and the %K line has a slight upward hook and tries to cross the %D line. This shows that although the short-term downward momentum is strong, it has also reached an extreme level, and the market may have a need for a technical rebound, especially when the indicator forms an effective golden cross.
- MA signal: The price has not only fallen below the 13EMA and 65EMA, but is also currently testing a potential horizontal support area on the chart (around $64.80-65.00, which was a consolidation platform from June 5 to 9). The green 200EMA (currently around $62.80-63.00) is still tilted upward, representing a longer-term important support level on the H2 level chart, and there is still some space from the current price.
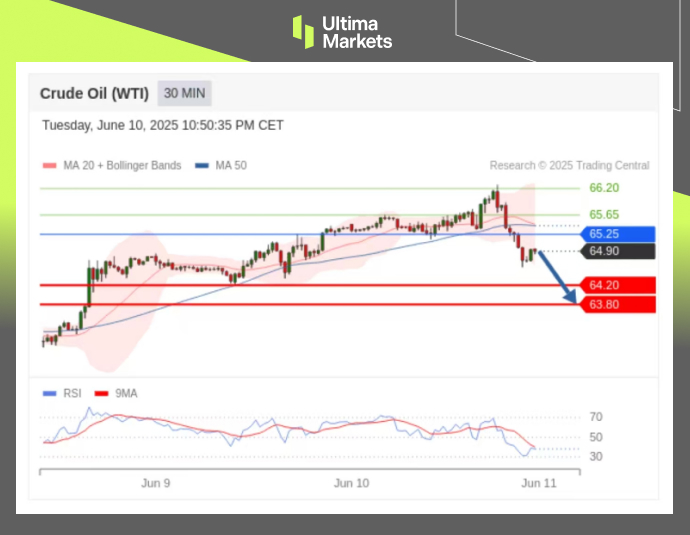
WTI OIL Pivot Indicator

- According to the trading central in Ultima Markets APP, the central price of the day is established at 65.25,
- Bullish Scenario: Bullish sentiment prevails above 65.25, first target 65.65 , second target 66.20;
- Bearish Outlook: In a bearish scenario below 65.25, first target 64.20, second target 63.80.
How to Navigate the Forex Market with Ultima Markets
To navigate the complex world of trading successfully, it’s imperative to stay informed and make data-driven decisions. Ultima Markets remains dedicated to providing you with valuable insights to empower your financial journey. For personalized guidance tailored to your specific financial situation, please do not hesitate to contact Ultima Markets.
Join Ultima Markets today and access a comprehensive trading ecosystem equipped with the tools and knowledge needed to thrive in the financial markets. Stay tuned for more updates and analyses from our team of experts at Ultima Markets.
—–
Legal Documents
Ultima Markets, a trading name of Ultima Markets Ltd, is authorized and regulated by the Financial Services Commission “FSC” of Mauritius as an Investment Dealer (Full-Service Dealer, excluding Underwriting) (license No. GB 23201593). The registered office address: 2nd Floor, The Catalyst, 40 Silicon Avenue, Ebene Cybercity, 72201, Mauritius.
Copyright © 2025 Ultima Markets Ltd. All rights reserved.
Disclaimer
Comments, news, research, analysis, price, and all information contained in the article only serve as general information for readers and do not suggest any advice. Ultima Markets has taken reasonable measures to provide up-to-date information, but cannot guarantee accuracy, and may modify without notice. Ultima Markets will not be responsible for any loss incurred due to the application of the information provided.
Why Trade Metals & Commodities with Ultima Markets?
Ultima Markets provides the foremost competitive cost and exchange environment for prevalent commodities worldwide.
Start TradingMonitoring the market on the go
Markets are susceptible to changes in supply and demand
Attractive to investors only interested in price speculation
Deep and diverse liquidity with no hidden fees
No dealing desk and no requotes
Fast execution via Equinix NY4 server


