This website is managed by Ultima Markets’ international entities, and it’s important to emphasise that they are not subject to regulation by the FCA in the UK. Therefore, you must understand that you will not have the FCA’s protection when investing through this website – for example:
You will not be guaranteed Negative Balance Protection
You will not be protected by FCA’s leverage restrictions
You will not have the right to settle disputes via the Financial Ombudsman Service (FOS)
You will not be protected by Financial Services Compensation Scheme (FSCS)
Any monies deposited will not be afforded the protection required under the FCA Client Assets Sourcebook. The level of protection for your funds will be determined by the regulations of the relevant local regulator.
Note: UK clients are kindly invited to visit https://www.ultima-markets.co.uk/. Ultima Markets UK expects to begin onboarding UK clients in accordance with FCA regulatory requirements in 2026.
If you would like to proceed and visit this website, you acknowledge and confirm the following:
1.The website is owned by Ultima Markets’ international entities and not by Ultima Markets UK Ltd, which is regulated by the FCA.
2.Ultima Markets Limited, or any of the Ultima Markets international entities, are neither based in the UK nor licensed by the FCA.
3.You are accessing the website at your own initiative and have not been solicited by Ultima Markets Limited in any way.
4.Investing through this website does not grant you the protections provided by the FCA.
5.Should you choose to invest through this website or with any of the international Ultima Markets entities, you will be subject to the rules and regulations of the relevant international regulatory authorities, not the FCA.
Ultima Markets wants to make it clear that we are duly licensed and authorised to offer the services and financial derivative products listed on our website. Individuals accessing this website and registering a trading account do so entirely of their own volition and without prior solicitation.
By confirming your decision to proceed with entering the website, you hereby affirm that this decision was solely initiated by you, and no solicitation has been made by any Ultima Markets entity.
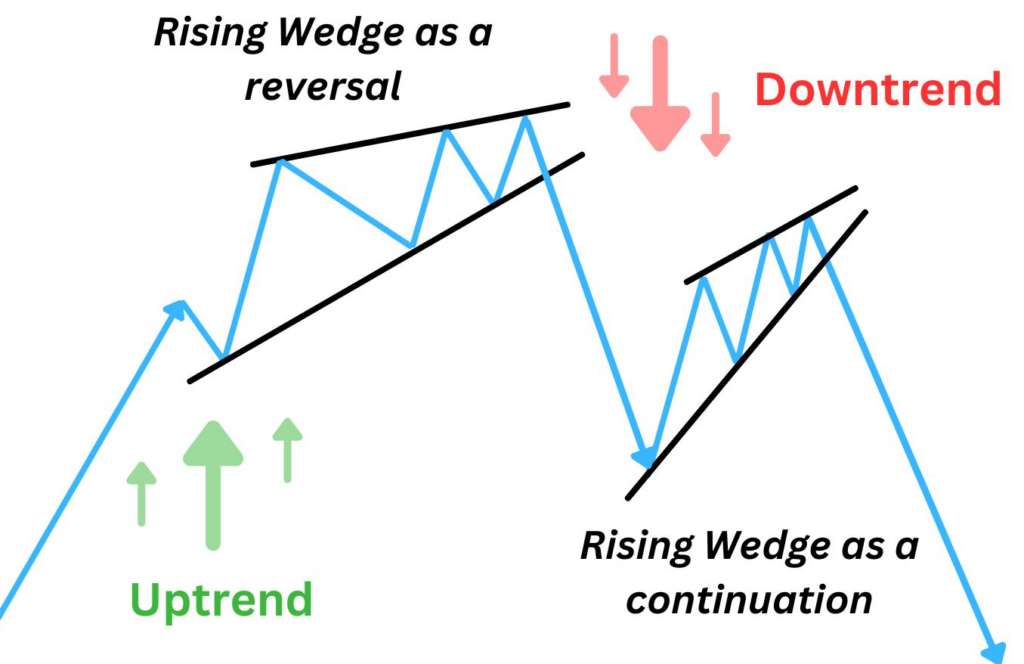
The rising wedge pattern is a bearish chart formation where two upward-sloping trendlines converge, signaling weakening bullish momentum and a potential downside breakout. It often appears after an uptrend and indicates a reversal as buyers lose strength and sellers prepare to take control.
The rising wedge pattern is one of the most powerful and commonly misunderstood chart formations in technical analysis. Traders use it to identify potential reversals or continuations in price, especially when markets are nearing exhaustion.
Key Features:
Two rising and converging trendlines
Volume tends to decrease as the pattern develops
Often leads to a bearish breakout
How to Trade Rising Wedge Pattern
Trading a rising wedge involves anticipating a potential breakdown from a weakening uptrend. Here’s how to trade it with clarity:
Identify the Pattern Look for price action that forms higher highs and higher lows, but within narrowing upward-sloping trendlines. This shows momentum is slowing.
Draw the Trendlines Connect at least two swing highs and two swing lows. Both lines should slope up, with the support line rising more steeply than the resistance.
Wait for a Breakdown Don’t jump in early. The best trades come after price breaks below the lower trendline, showing that buyers can no longer hold the uptrend.
Look for Confirmation Volume should increase on the breakdown, or you should see a break of structure (BOS), like a lower low forming, to confirm bearish intent.
Plan the Entry A high-probability entry is on the retest of the broken trendline. If price retests the underside and shows rejection (e.g., bearish candle), it signals sellers are in control.
Set Your Stop Loss Place the stop just above the last swing high inside the wedge. This protects you if the pattern fails and price rallies back into the wedge.
Set Your Profit Target Measure the height of the wedge at its widest point. Project that distance downward from the breakout point to set a realistic target.
Rising Wedge Pattern in Uptrend
The rising wedge is especially powerful in an uptrend because it signals trend exhaustion. As price rises within the wedge, the momentum slows. Once support breaks, a sharp reversal often follows.
In Uptrends:
Acts as a trend reversal pattern
Indicates weakening bullish strength
Leads to a potential bearish move
Rising Wedge Pattern: Bullish or Bearish?
Despite the upward movement inside the wedge, the rising wedge pattern is bearish. It suggests that bullish momentum is fading, and sellers may soon take control.
However, context matters:
In an uptrend: Rising wedge = bearish reversal
In a downtrend: Rising wedge = bearish continuation
So, while the pattern forms during a rally, the expected breakout is downward.
Rising Wedge vs Falling Wedge: What’s the Difference?
While both patterns indicate market indecision and a squeeze in volatility, they break out in opposite directions. Recognizing the type of wedge helps you position trades correctly based on market bias.
Feature
Rising Wedge
Falling Wedge
Trendline Direction
Upward
Downward
Expected Breakout
Bearish (down)
Bullish (up)
Signal Type
Bearish reversal
Bullish reversal
Volume Behavior
Decreasing
Decreasing
Strategies to Trade Wedge Pattern
Here are several trading strategies for wedge patterns:
Breakout Retest Entry
Wait for breakout and retest of trendline
Enter on confirmation candle
Pattern Completion Target
Use the widest part of the wedge to project profit target
Confluence Trading
Combine with indicators like RSI divergence, FVGs, or key support/resistance
Conclusion
The rising wedge pattern is a reliable signal of bearish pressure, especially in uptrending markets. With proper risk management, volume confirmation, and patience, traders can use this pattern to catch early reversals or continue riding trends with confidence.
If you’re looking for a regulated platform that offers advanced charting tools, competitive spreads, and educational support for pattern-based trading, Ultima Markets is an ideal choice for both beginner and professional traders.
Disclaimer: This content is provided for informational purposes only and does not constitute, and should not be construed as, financial, investment, or other professional advice. No statement or opinion contained here in should be considered a recommendation by Ultima Markets or the author regarding any specific investment product, strategy, or transaction. Readers are advised not to rely solely on this material when making investment decisions and should seek independent advice where appropriate.
Thank you for visiting the Ultima Markets website. Please note that this website is intended for individuals residing in jurisdictions where accessing is permitted by law. Ultima and its affiliated entities do not operate in your home jurisdictions.
By clicking on ''Acknowledge'', you confirm that you are entering this website solely based on your initiative and not as a result of any specific marketing outreach. You wish to obtain information from this website based on reverse solicitation principles, in accordance with the applicable laws of your home jurisdiction.