Important Information
This website is managed by Ultima Markets’ international entities, and it’s important to emphasise that they are not subject to regulation by the FCA in the UK. Therefore, you must understand that you will not have the FCA’s protection when investing through this website – for example:
- You will not be guaranteed Negative Balance Protection
- You will not be protected by FCA’s leverage restrictions
- You will not have the right to settle disputes via the Financial Ombudsman Service (FOS)
- You will not be protected by Financial Services Compensation Scheme (FSCS)
- Any monies deposited will not be afforded the protection required under the FCA Client Assets Sourcebook. The level of protection for your funds will be determined by the regulations of the relevant local regulator.
Note: UK clients are kindly invited to visit https://www.ultima-markets.co.uk/. Ultima Markets UK expects to begin onboarding UK clients in accordance with FCA regulatory requirements in 2026.
If you would like to proceed and visit this website, you acknowledge and confirm the following:
- 1.The website is owned by Ultima Markets’ international entities and not by Ultima Markets UK Ltd, which is regulated by the FCA.
- 2.Ultima Markets Limited, or any of the Ultima Markets international entities, are neither based in the UK nor licensed by the FCA.
- 3.You are accessing the website at your own initiative and have not been solicited by Ultima Markets Limited in any way.
- 4.Investing through this website does not grant you the protections provided by the FCA.
- 5.Should you choose to invest through this website or with any of the international Ultima Markets entities, you will be subject to the rules and regulations of the relevant international regulatory authorities, not the FCA.
Ultima Markets wants to make it clear that we are duly licensed and authorised to offer the services and financial derivative products listed on our website. Individuals accessing this website and registering a trading account do so entirely of their own volition and without prior solicitation.
By confirming your decision to proceed with entering the website, you hereby affirm that this decision was solely initiated by you, and no solicitation has been made by any Ultima Markets entity.
I confirm my intention to proceed and enter this website Please direct me to the website operated by Ultima Markets , regulated by the FCA in the United Kingdom
Ultima Markets App
Trade Anytime, Anywhere


Russell 1000 vs S&P 500, Which is Better?
Investors often compare the Russell 1000 vs S&P 500 to determine which index better represents the U.S. equity market and offers stronger returns. Both indices track large-cap U.S. stocks, but they differ in composition, methodology, and risk exposure. This article provides a detailed, data-backed comparison to help you understand their differences and choose the right benchmark for your portfolio.
Before you make any investment decision, it’s important to understand what the Russell 1000 and S&P 500 indices are and how they differ.
What Is the Russell 1000 Index?
The Russell 1000 is a stock index made up of the 1,000 largest U.S. companies by market cap. It covers about 93% of the total U.S. equity market.
- Launched by: FTSE Russell
- Number of stocks: ~1,000
- Market cap coverage: ~93% of the U.S. equity market
What Is the S&P 500 Index?
The S&P 500 is a stock index of 500 major U.S. companies. It covers around 80% of the market and reflects the core of the American economy.
- Managed by: S&P Dow Jones Indices
- Number of stocks: 500
- Market cap coverage: ~80% of the U.S. equity market
Key Differences Between Russell 1000 vs S&P 500
| Feature | Russell 1000 | S&P 500 |
| Number of stocks | ~1000 | 500 |
| Market cap coverage | ~93% | ~80% |
| Selection method | Market cap only | Market cap + committee approval |
| Index provider | FTSE Russell | S&P Dow Jones Indices |
| Exposure | Large- and mega-cap | Mostly mega-cap |
| Broader diversification | Yes | No |
| Common companies | Apple, Microsoft, Amazon etc. | Apple, Microsoft, Amazon etc. |
| Includes smaller large-caps | Yes | No |
| Historical performance | Slightly lower | Slightly higher (due to tech weighting) |
Russell 1000 vs S&P 500: Total Return Comparison
Over the past decade, the S&P 500 has slightly outperformed the Russell 1000, primarily due to its higher concentration in top-performing mega-cap tech stocks.
10-Year Annualized Returns (as of 2024):
- S&P 500: ~11.7%
- Russell 1000: ~11.4%
While the difference is small, the S&P 500 benefited more from names like Apple, Microsoft, and Nvidia due to its higher weighting in these stocks.
Total Return Index (2014–2024)
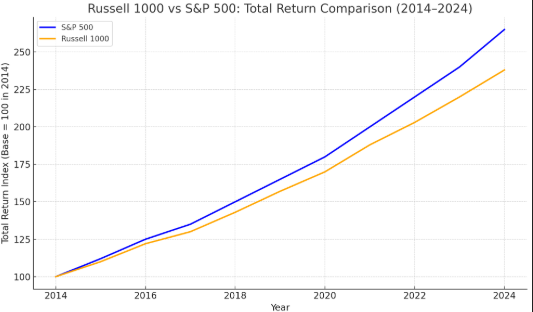
Based on the chart above, it illustrates how both indices have grown over the past decade, with the S&P 500 showing a slightly steeper upward curve thanks to its tech concentration., the S&P 500 has slightly outperformed the Russell 1000, primarily due to its higher concentration in top-performing mega-cap tech stocks.
Companies in the Russell 1000
The Russell 1000 includes the largest U.S. companies by market cap, offering both mega-cap and large-cap exposure. Examples include:
- Apple (AAPL)
- Microsoft (MSFT)
- Amazon (AMZN)
- Berkshire Hathaway (BRK.B)
- JPMorgan Chase (JPM)
- Caterpillar (CAT)
- General Electric (GE)
- United Parcel Service (UPS)
It provides broader representation than the S&P 500, including many companies not featured in the latter.
Companies in the S&P 500
The S&P 500 includes 500 leading U.S. companies across various sectors. These firms are selected based on size, liquidity, and profitability. Key companies include:
- Apple (AAPL)
- Microsoft (MSFT)
- Amazon (AMZN)
- Alphabet (GOOGL)
- Meta Platforms (META)
- Johnson & Johnson (JNJ)
- ExxonMobil (XOM)
- Procter & Gamble (PG)
The S&P 500 is heavily weighted toward mega-cap technology and healthcare stocks, which often drive its performance.
Which Index Is Better: Russell 1000 or S&P 500?
| Criteria | Russell 1000 | S&P 500 |
| Best for | Broader larger-cap exposure | Mega-cap growth and tech leadership |
| Diversification | Higher (more stocks) | Lower (more concentrated) |
| Historical performance | Slightly lower | Slightly higher |
| Tech weighting | Moderate | High |
| Investment style | Passive, wide net | Focused, high quality filter |
Both indices offer strong U.S. market exposure. The S&P 500 may suit investors seeking growth from dominant companies, while the Russell 1000 fits those prioritizing broad market coverage.
Key Takeaways
- The Russell 1000 includes more stocks and broader exposure than the S&P 500.
- The S&P 500 has slightly outperformed in recent years due to its tech-heavy tilt.
- Both are excellent benchmarks for large-cap U.S. equity exposure.
- Your choice depends on diversification needs and risk preferences.
Russell 1000 vs S&P 500 ETFs: What’s the Difference?
Investors can gain exposure to these indices through ETFs, but it’s important to distinguish between the index and the ETF itself.
- An index is a theoretical portfolio used to track the performance of a specific market segment.
- An ETF (Exchange-Traded Fund) is a tradable security that aims to replicate the returns of that index.
Here’s how the Russell 1000 and S&P 500 ETFs compare:
| ETF | Tracks | Ticker | Expense Ratio |
| iShares Russell 1000 ETF | Russell 1000 Index | IWB | 0.15% |
| SPDR S&P 500 ETF Trust | S&P 500 Index | SPY | 0.09% |
| iShares Core S&P 500 ETF | S&P 500 Index | IVV | 0.03% |
The S&P 500 ETFs tend to have lower fees and higher liquidity, while Russell 1000 ETFs offer broader exposure but with slightly higher costs.
Sector Allocation Comparison
The sector weighting of each index significantly affects performance. The S&P 500 leans more heavily into technology and healthcare, while the Russell 1000 offers slightly more balance across sectors.
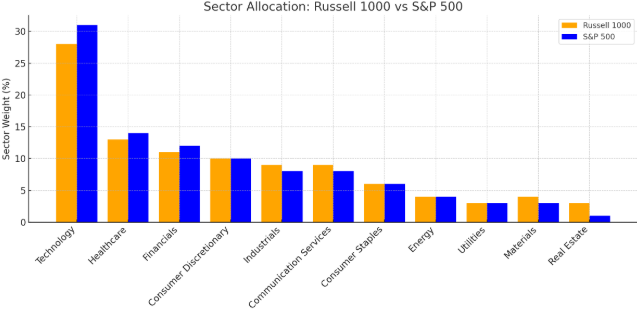
This chart illustrates the differences in sector composition between the two indices. The S&P 500 has a larger tilt toward tech, which has fueled its outperformance in recent years. Meanwhile, the Russell 1000 includes more exposure to industrials, real estate, and mid-range large caps, offering broader economic coverage. to these indices through ETFs. Here’s how they compare:
| ETF | Tracks | Ticker | Expense Ratio |
| iShares Russell 1000 ETF | Russell 1000 | IWB | 0.15% |
| SPDR S&P 500 ETF Trust | S&P 500 | SPY | 0.09% |
| iShares Core S&P 500 ETF | S&P 500 | IVV | 0.03% |
Conclusion
Both the Russell 1000 and S&P 500 provide strong exposure to U.S. large-cap equities. If you’re looking for broader diversification with exposure to more companies, the Russell 1000 may suit your strategy. On the other hand, if you prefer concentrated exposure to top-performing mega-cap stocks, especially tech like the S&P 500 often leads in performance.
For smarter, data-driven investing, explore the tools and global market access offered by Ultima Markets. Whether you’re building long-term wealth or actively trading, Ultima Markets empowers you with the insights and platforms you need.
Disclaimer: This content is provided for informational purposes only and does not constitute, and should not be construed as, financial, investment, or other professional advice. No statement or opinion contained here in should be considered a recommendation by Ultima Markets or the author regarding any specific investment product, strategy, or transaction. Readers are advised not to rely solely on this material when making investment decisions and should seek independent advice where appropriate.
Latest Articles


FOLLOW US


Ultima Markets is a member of The Financial Commission, an international independent body responsible for resolving disputes in the Forex and CFD markets.
All clients of Ultima Markets are protected under insurance coverage provided by Willis Towers Watson (WTW), a global insurance brokerage established in 1828, with claims eligibility up to US$1,000,000 per account.
Ultima Markets is the first United CFD broker to be part of the United Nations Global Compact.
FOLLOW US
TRADE WITH US
RISK DISCLOSURE
Risk Warning:
Trading leveraged financial products, including Contracts for Difference (CFDs), carries a high level of risk and may result in losses exceeding your initial investment. These products are not suitable for all investors and should only be traded with funds you can afford to lose. You do not own or have any rights to the underlying assets of these derivatives (e.g., entitlement to dividends). Please ensure you fully understand the associated risks. Before trading, consider your level of experience, investment objectives, and seek independent financial advice if necessary. Refer to our legal documents and disclosures before making any trading decisions.
General Advice Warning:
The information provided on this website is general in nature and does not take into account your personal objectives, financial situation, or needs. Before acting on any advice, you should assess its appropriateness in light of your individual circumstances and consult our legal documentation.
Regional Restrictions:
The information and services on this website are not intended for residents of certain jurisdictions, including but not limited to the United States, United Kingdom, Singapore, and any jurisdictions subject to international sanctions. For further information, please contact our customer support team.
Regulatory Information:
Ultima Markets is a trading name shared amongst multiple entities operating in various jurisdictions. These following entities are authorised to operate under the Ultima Markets brand and trademarks.
-
Ultima Markets UK Limited, reference number 470325, is authorised and regulated by the Financial Conduct Authority (FCA). Registered address: 1 Blossom Yard, Fourth Floor, London, E1 6RS, UNITED KINGDOM.
-
Ultima Markets Ltd is authorised and regulated by the Financial Services Commission (FSC) of Mauritius as a Full-Service Investment Dealer (excluding Underwriting), under licence number GB 23201593.
Registered address: 2nd Floor, The Catalyst, 40 Silicon Avenue, Ebene Cybercity, 72201, Mauritius.
-
Ultima Markets EU OÜ, incorporated in Estonia with registry code 17134727. Registered address: Harju maakond, Tallinn, Kristiine linnaosa, Seebi tn 1-1501, 11316. This entity does not offer regulated financial products or provide trading services.
Copyright © 2026 Ultima Markets Ltd. All rights reserved.
-

Messenger


Continue on Messenger
Take the conversation to your Messenger account. You can return anytime.
Scan the QR code and then send the message that appears in your Messenger.
Open Messenger on this device.
-

Instagram

Continue on Instagram
Take the conversation to your Instagram account. You can return anytime.
Scan the QR code to open Instagram. Follow @ultima_markets to send a DM.
Open Instagram on this device.
-

Live Chat
-
