Important Information
This website is managed by Ultima Markets’ international entities, and it’s important to emphasise that they are not subject to regulation by the FCA in the UK. Therefore, you must understand that you will not have the FCA’s protection when investing through this website – for example:
- You will not be guaranteed Negative Balance Protection
- You will not be protected by FCA’s leverage restrictions
- You will not have the right to settle disputes via the Financial Ombudsman Service (FOS)
- You will not be protected by Financial Services Compensation Scheme (FSCS)
- Any monies deposited will not be afforded the protection required under the FCA Client Assets Sourcebook. The level of protection for your funds will be determined by the regulations of the relevant local regulator.
Note: UK clients are kindly invited to visit https://www.ultima-markets.co.uk/. Ultima Markets UK expects to begin onboarding UK clients in accordance with FCA regulatory requirements in 2026.
If you would like to proceed and visit this website, you acknowledge and confirm the following:
- 1.The website is owned by Ultima Markets’ international entities and not by Ultima Markets UK Ltd, which is regulated by the FCA.
- 2.Ultima Markets Limited, or any of the Ultima Markets international entities, are neither based in the UK nor licensed by the FCA.
- 3.You are accessing the website at your own initiative and have not been solicited by Ultima Markets Limited in any way.
- 4.Investing through this website does not grant you the protections provided by the FCA.
- 5.Should you choose to invest through this website or with any of the international Ultima Markets entities, you will be subject to the rules and regulations of the relevant international regulatory authorities, not the FCA.
Ultima Markets wants to make it clear that we are duly licensed and authorised to offer the services and financial derivative products listed on our website. Individuals accessing this website and registering a trading account do so entirely of their own volition and without prior solicitation.
By confirming your decision to proceed with entering the website, you hereby affirm that this decision was solely initiated by you, and no solicitation has been made by any Ultima Markets entity.
I confirm my intention to proceed and enter this website Please direct me to the website operated by Ultima Markets , regulated by the FCA in the United Kingdom
Ultima Markets App
Trade Anytime, Anywhere


NASDAQ vs S&P 500, Which is Better?
When it comes to investing in the U.S. stock market, two benchmarks dominate investor decisions: the NASDAQ and the S&P 500. These indices not only reflect the overall health of the market but also represent two distinct investment strategies, one focused on high-growth technology and the other on broad sector diversification.
As investors increasingly ask, “Which index is better for the long term?” it’s crucial to break down their structure, performance, and risks. This guide will help you understand the key differences between NASDAQ vs S&P 500 and decide which aligns with your financial goals.
Key Takeaways:
- NASDAQ 100 is tech-heavy and offers higher growth potential but more volatility.
- S&P 500 is more diversified across sectors and provides more stability.
- Over the past 20 years, NASDAQ has outperformed, especially during tech booms.
- Choose based on your risk tolerance, time horizon, and sector outlook.
- Many investors combine both indices using ETFs like QQQ and SPY.
First, let’s take a look at what the NASDAQ and the S&P 500 are. Once we understand their key differences, we can explore their long-term performance and investment implications in greater context.
What Is NASDAQ?
The NASDAQ (National Association of Securities Dealers Automated Quotations) is a global electronic marketplace for buying and selling securities. It’s known for being home to many of the world’s largest technology companies, including Apple, Microsoft, Amazon, and Meta. The NASDAQ Composite Index tracks more than 3,000 stocks listed on the Nasdaq Stock Exchange, while the NASDAQ 100 focuses on the 100 largest non-financial companies, heavily concentrated in the tech sector.
What Is S&P 500?
The S&P 500 (Standard & Poor’s 500) is a stock market index that tracks 500 of the largest publicly traded companies in the U.S., across multiple industries such as technology, healthcare, energy, finance, and consumer goods. It is widely considered the best single gauge of large-cap U.S. equities, providing a more balanced and diversified view of the overall market.
Key Differences Between NASDAQ vs S&P 500
The NASDAQ Composite and the S&P 500 are both major U.S. stock market indices, but they differ significantly in composition and purpose:
| Feature | NASDAQ Composite | S&P 500 |
| Number of Stocks | 3,000+ | 500 |
| Type of Companies | Primarily tech and growth-oriented | Large-cap US companies across all sectors |
| Sector Focus | Tech-heavy | Diversified (tech, healthcare, financial etc.) |
| Market Cap Focus | Mix of large-, medium-, and small-cap | Large-cap only |
| Exchange | Nasdaq Stock Market | NYSE & Nasdaq |
| Volatility | Higher | Lower |
NASDAQ Composite includes over 3,000 stocks listed on the Nasdaq Stock Market. It is heavily weighted towards technology and growth stocks.
S&P 500 represents 500 of the largest publicly traded U.S. companies and is more broadly diversified across sectors, including healthcare, finance, and industrials.
Key Differences Between NASDAQ 100 vs S&P 500
The NASDAQ 100 is a subset of the NASDAQ Composite, consisting of the 100 largest non-financial companies listed on Nasdaq. Here’s how it stacks up against the S&P 500:
| Feature | NASDAQ 100 | S&P 500 |
| Number of Companies | 100 | 500 |
| Sector Focus | Tech-heavy | Broad sectors |
| Market Cap Focus | Large-cap growth | Large-cap blend |
| Inclusion of Financials | No | Yes |
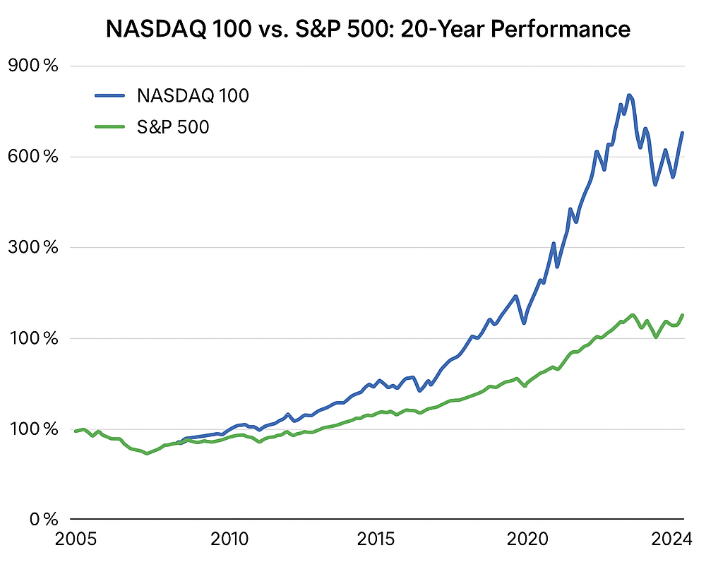
This chart illustrates how the NASDAQ 100 and S&P 500 have performed over the past two decades. While both indices have grown significantly, the NASDAQ 100 has delivered far higher returns driven by its concentration in technology and high-growth companies.
However, it also experienced sharper corrections, reflecting its greater volatility. The S&P 500, in contrast, shows steadier growth due to its diversified sector exposure.
NASDAQ vs S&P 500 Historical Returns
Over the past two decades, NASDAQ 100 has outperformed the S&P 500 during periods of tech boom. For example:
- 2009–2021: The NASDAQ 100 had an annualized return of ~20%, significantly outpacing the S&P 500’s ~14%.
- However, during market corrections (e.g., 2022), the NASDAQ fell harder due to overexposure to high-growth stocks.
This reinforces the point that while NASDAQ offers higher growth potential, it also comes with greater risk.
S&P 500 vs NASDAQ Chart Comparison
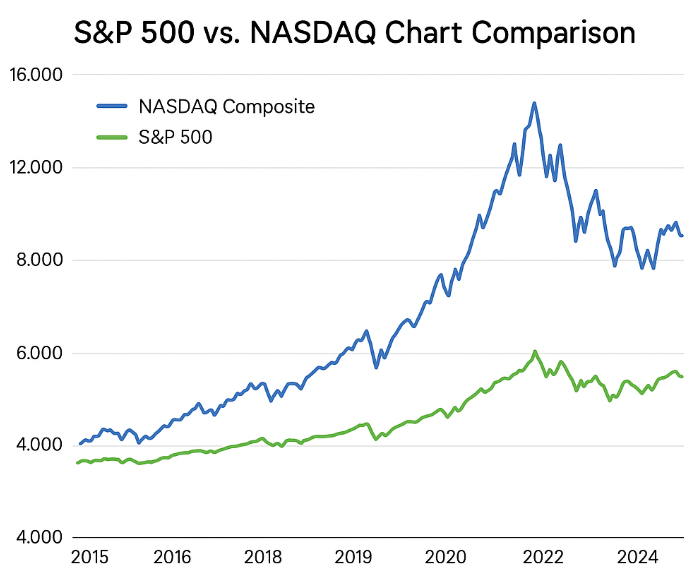
This chart compares the performance of the NASDAQ Composite and the S&P 500 from 2015 to 2024. The blue line represents the NASDAQ Composite, showing rapid growth from 2019 to 2021, followed by high volatility in recent years.
The green line, representing the S&P 500, shows a more stable and gradual upward trend. This highlights the tech-driven momentum of NASDAQ compared to the broad, diversified growth of the S&P 500.
Many investors look at historical charts to make informed decisions. Here’s what chart comparisons typically reveal:
- NASDAQ spikes higher in bull markets (e.g., 2010–2021)
- S&P 500 is more stable during downturns, thanks to its sector diversification
A visual look at long-term performance can help investors decide which index aligns with their risk tolerance.
Which Index Should You Invest In?
When deciding between the NASDAQ vs S&P 500, consider:
- Risk Tolerance: Prefer stability? Choose the S&P 500. Want higher upside? NASDAQ might suit you.
- Time Horizon: Long-term investors may benefit from riding out NASDAQ volatility for greater returns.
- Sector Preferences: If you believe in tech’s future, NASDAQ exposure offers focused access.
FAQs
What is Nasdaq vs S&P 500?
It’s a comparison of two key U.S. stock market indices—one tech-heavy (NASDAQ), the other broad-based (S&P 500).
What is the difference between Nasdaq 100 and S&P 500?
NASDAQ 100 contains the top 100 non-financial companies on Nasdaq, while S&P 500 includes 500 large-cap U.S. stocks across multiple sectors.
Can I invest in both?
Yes. Many ETFs track each index, allowing you to diversify with ease.
Conclusion
Both the NASDAQ 100 and the S&P 500 are solid long-term investment options. The NASDAQ 100 tends to offer higher growth potential, particularly for investors seeking exposure to innovative tech and biotech companies. On the other hand, the S&P 500 provides broad diversification across sectors, making it a more balanced and stable choice during volatile periods.
At Ultima Markets, we provide the tools, analysis, and market insights to help you make informed decisions whether you’re investing in major indices, forex, or other asset classes. Trade smarter with Ultima Markets.
Disclaimer: This content is provided for informational purposes only and does not constitute, and should not be construed as, financial, investment, or other professional advice. No statement or opinion contained here in should be considered a recommendation by Ultima Markets or the author regarding any specific investment product, strategy, or transaction. Readers are advised not to rely solely on this material when making investment decisions and should seek independent advice where appropriate.
Latest Articles


FOLLOW US


Ultima Markets is a member of The Financial Commission, an international independent body responsible for resolving disputes in the Forex and CFD markets.
All clients of Ultima Markets are protected under insurance coverage provided by Willis Towers Watson (WTW), a global insurance brokerage established in 1828, with claims eligibility up to US$1,000,000 per account.
Ultima Markets is the first United CFD broker to be part of the United Nations Global Compact.
FOLLOW US
TRADE WITH US
RISK DISCLOSURE
Risk Warning:
Trading leveraged financial products, including Contracts for Difference (CFDs), carries a high level of risk and may result in losses exceeding your initial investment. These products are not suitable for all investors and should only be traded with funds you can afford to lose. You do not own or have any rights to the underlying assets of these derivatives (e.g., entitlement to dividends). Please ensure you fully understand the associated risks. Before trading, consider your level of experience, investment objectives, and seek independent financial advice if necessary. Refer to our legal documents and disclosures before making any trading decisions.
General Advice Warning:
The information provided on this website is general in nature and does not take into account your personal objectives, financial situation, or needs. Before acting on any advice, you should assess its appropriateness in light of your individual circumstances and consult our legal documentation.
Regional Restrictions:
The information and services on this website are not intended for residents of certain jurisdictions, including but not limited to the United States, United Kingdom, Singapore, and any jurisdictions subject to international sanctions. For further information, please contact our customer support team.
Regulatory Information:
Ultima Markets is a trading name shared amongst multiple entities operating in various jurisdictions. These following entities are authorised to operate under the Ultima Markets brand and trademarks.
-
Ultima Markets UK Limited, reference number 470325, is authorised and regulated by the Financial Conduct Authority (FCA). Registered address: 1 Blossom Yard, Fourth Floor, London, E1 6RS, UNITED KINGDOM.
-
Ultima Markets Ltd is authorised and regulated by the Financial Services Commission (FSC) of Mauritius as a Full-Service Investment Dealer (excluding Underwriting), under licence number GB 23201593.
Registered address: 2nd Floor, The Catalyst, 40 Silicon Avenue, Ebene Cybercity, 72201, Mauritius.
-
Ultima Markets EU OÜ, incorporated in Estonia with registry code 17134727. Registered address: Harju maakond, Tallinn, Kristiine linnaosa, Seebi tn 1-1501, 11316. This entity does not offer regulated financial products or provide trading services.
Copyright © 2026 Ultima Markets Ltd. All rights reserved.
-

Messenger


Continue on Messenger
Take the conversation to your Messenger account. You can return anytime.
Scan the QR code and then send the message that appears in your Messenger.
Open Messenger on this device.
-

Instagram

Continue on Instagram
Take the conversation to your Instagram account. You can return anytime.
Scan the QR code to open Instagram. Follow @ultima_markets to send a DM.
Open Instagram on this device.
-

Live Chat
-
