
Focus on EUR/USD today.
Fundamentally, the Federal Reserve will announce its latest interest rate decision, and it is basically a certainty that interest rates will remain unchanged. However, since the Federal Reserve will also release its latest Summary of Economic Predictions(SEP), the dot plot is the focus of the market’s attention.
The most debated question right now is whether the Fed will raise interest rates by the end of the year, and whether the monetary policy in 2024 will change the stance taken in June and a more conservative interest rate path will be adopted. These all affect the direction of the U.S. dollar index. If the Federal Reserve changes its stance on interest rate cuts in 2024, the U.S. dollar index will fall significantly. Otherwise, the U.S. dollar index will further break through the high point.
Technically, although the stochastic oscillator has crossed upward on the daily chart, the exchange rate has always been suppressed by the 5-day moving average, and the market is more likely to form a consolidation range.
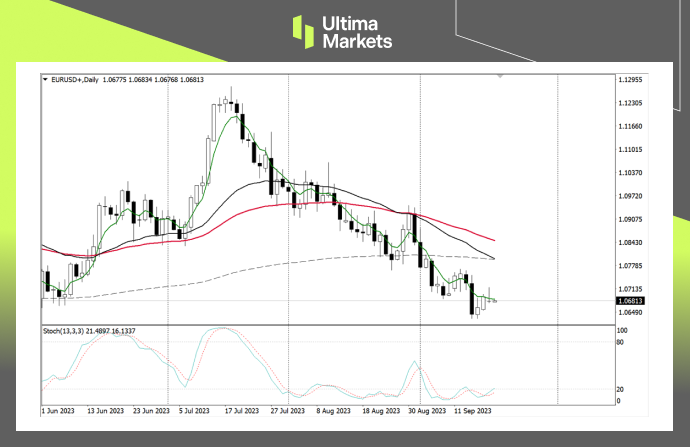
( Daily chart of EUR/USD, source: Ultima Markets MT4)
The candle bar yesterday was a pin bar, so the structure today is more important. If it breaks through yesterday’s high, the market’s rebound space will further look closer to the 200-day moving average; if a large physical candle bar closes today, the exchange rate may fall further.
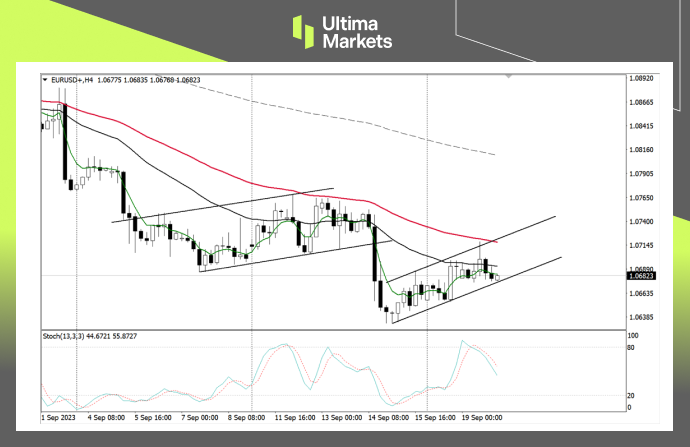
(4-hour chart of EUR/USD, source: Ultima Markets MT4)
On the 4-hour chart, after the market hit the resistance area composed of the 65-day moving average and the 33-day moving average, the stochastic oscillator began to cross downward. Structurally, the EURUSD has formed a relatively clear rising flag-shaped consolidation area, and there is a certain probability that the short trend will continue after falling below it.
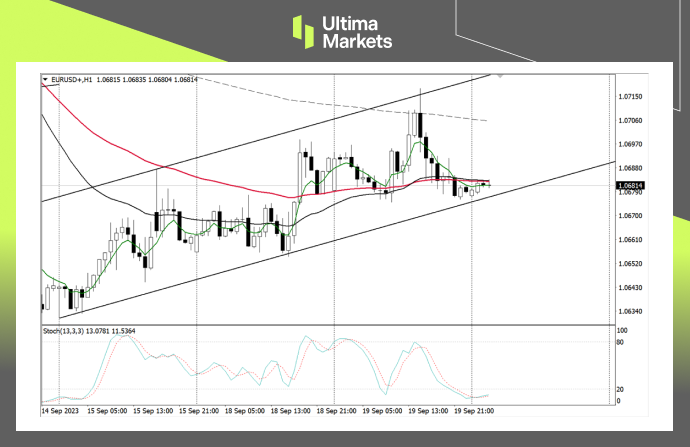
(1-hour chart of EUR/USD, source: Ultima Markets MT4)
If you look at the 1-hour chart structure, you will find it is clearer. As the stochastic oscillator remains in oversold territory, the Asian session may remain consolidated. You need to wait patiently for the price to fall below yesterday’s low and the lower edge of the flag channel, and then switch to a smaller cycle to look for intraday entry opportunities.
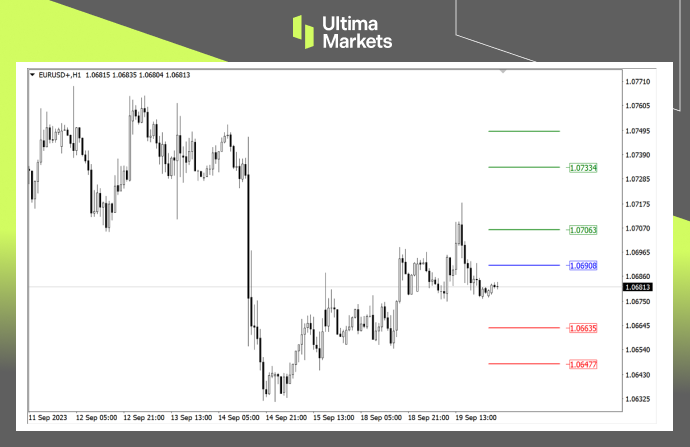
(1-hour chart of EUR/USD, source: Ultima Markets MT4)
According to the pivot indicator in Ultima Markets MT4, the central price of the day is 1.06908.
Bullish above 1.06908, first target 1.07063, second target 1.07334
Bearish below 1.06908, first target 1.06635, second target 1.06477
Disclaimer
Comments, news, research, analysis, prices and other information contained in this article can only be regarded as general market information, provided only to help readers understand the market situation, and do not constitute investment advice. Ultima Markets will not be responsible for any loss or loss (including but not limited to any loss of profits) that may arise from the direct or indirect use or reliance on such information.