Important Information

This website is managed by Ultima Markets’ international entities, and it’s important to emphasise that they are not subject to regulation by the FCA in the UK. Therefore, you must understand that you will not have the FCA’s protection when investing through this website – for example:

  • You will not be guaranteed Negative Balance Protection
  • You will not be protected by FCA’s leverage restrictions
  • You will not have the right to settle disputes via the Financial Ombudsman Service (FOS)
  • You will not be protected by Financial Services Compensation Scheme (FSCS)
  • Any monies deposited will not be afforded the protection required under the FCA Client Assets Sourcebook. The level of protection for your funds will be determined by the regulations of the relevant local regulator.

Note: Ultima Markets is currently developing a dedicated website for UK clients and expects to onboard UK clients under FCA regulations in 2026.

If you would like to proceed and visit this website, you acknowledge and confirm the following:

  • 1.The website is owned by Ultima Markets’ international entities and not by Ultima Markets UK Ltd, which is regulated by the FCA.
  • 2.Ultima Markets Limited, or any of the Ultima Markets international entities, are neither based in the UK nor licensed by the FCA.
  • 3.You are accessing the website at your own initiative and have not been solicited by Ultima Markets Limited in any way.
  • 4.Investing through this website does not grant you the protections provided by the FCA.
  • 5.Should you choose to invest through this website or with any of the international Ultima Markets entities, you will be subject to the rules and regulations of the relevant international regulatory authorities, not the FCA.

Ultima Markets wants to make it clear that we are duly licensed and authorised to offer the services and financial derivative products listed on our website. Individuals accessing this website and registering a trading account do so entirely of their own volition and without prior solicitation.

By confirming your decision to proceed with entering the website, you hereby affirm that this decision was solely initiated by you, and no solicitation has been made by any Ultima Markets entity.

I confirm my intention to proceed and enter this website Please direct me to the website operated by Ultima Markets , regulated by the FCA in the United Kingdom

Why FOMC Meeting Is Important for Your Trading

First things first, FOMC stands for the Federal Open Market Committee. Think of it as the mastermind behind the scenes, making decisions that can send shockwaves through the financial markets. In this article, we are going to walk you through the FOMC Meeting, and explain why it is a big deal for you.

  • Interest rate decision:

Imagine you are at an amusement park, and the FOMC is controlling the speed of the roller coaster. Interest rates are just like the gas pedal for the economy. When the FOMC decides to raise interest rate, borrowing money becomes more costly. This can cool down an overheated economy and tame inflation. On the other hand, when they lower interest rates, borrowing money becomes cheaper, thereby boosting spending and investment. These rate decisions can jolt the values of currency pairs, stocks, or commodities.

  • Market mood:

Experienced traders tend to analyze every word the FOMC utters during the meeting to predict what’s coming next. If the FOMC hints at rate hikes, traders might expect currency values to rise. If they signal rate cuts, stock prices might skyrocket. You may grab a competitive edge by hunting for clues from their statement.

  • Volatility swing:

FOMC meetings can feel just like a roller coaster. Currencies might leap, stocks can soar or plummet, and commodities might go on a wild ride. The thrilling volatility may catch inexperienced traders off guard. That’s why knowing when the FOMC is meeting and preparing for their announcements is a savvy move.

Summary

In a nutshell, FOMC decisions about interest rates will impact economies and market expectations, and send waves around the globe. For CFD traders, knowing these meetings and how they can shape the markets will give you an upper hand.

Key Fundamental Factors Affecting the Financial Market

Fundamental factors are like puzzle pieces that shape the big picture of the financial world. These factors can influence the value of assets such as currency pairs, stocks, commodities, and even cryptos. In this article, we will uncover such key factors, which often create opportunities for intelligent investors and traders.

  • Geopolitical events:

Geopolitical factors like wars, elections, trade deals, or conflicts can cause ripples in the markets. Positive events can boost investor confidence, while negative news can trigger uncertainty. You are highly recommended to stay updated on global affairs to anticipate how they might impact your trades.

  • Economic indicators:

Economic indicators are like the scoreboard, showing the health of a country’s economy. When GDP (Gross Domestic Product) goes up, it’s a sign of economic strength. Low unemployment rates mean people have jobs and money to spend. Inflation, the rise in prices, affects consumers’ buying power. And interest rates set by central banks can make borrowing cheaper or pricier. These indicators affect market sentiment, and understanding them gives you an edge.

  • Corporate earnings:

Corporate earnings can reveal how well a company is doing. Strong earnings mean the company is making money, which can lead to higher stock prices. Keep an eye on quarterly reports and profit margins – they’re your insider’s ticket to predicting movements of stocks and indices.

  • Natural disaster or climate events:

Imagine you’re a scientist observing nature’s forces. Natural disasters like hurricanes, earthquakes, or droughts can disrupt supply chains and affect commodity prices. Climate events, like changing weather patterns, impact agricultural products. Keeping an eye on these factors helps you anticipate potential market shifts.

  • Market sentiment:

Imagine you’re a scientist observing nature’s forces. Natural disasters like hurricanes, earthquakes, or droughts can disrupt supply chains and affect commodity prices. Climate events, like changing weather patterns, impact agricultural products. Keeping an eye on these factors helps you anticipate potential market shifts.

Summary

By understanding fundamental factors, you can predict how the market might change. For example, if an economic indicator suggests a strong economy, you might expect stock prices to rise. If geopolitical tensions increase, currencies might fluctuate.

In a word, fundamental factors are the driving forces behind price movements. Understanding them will give you a competitive edge.

Introduction to Fundamental Analysis

If you are eager to understand the magic behind the financial markets, look no further than fundamental analysis! It’s time to unlock this exciting aspect of CFD trading and show you how to take advantage of it like a pro.

What Is Fundamental Analysis?

Fundamental analysis is all about exploring the real factors that drive the prices of financial assets like currency pairs, stocks, commodities, or cryptos. Unlike technical analysis, fundamental analysis focuses on the big picture, considering economic, financial, and geopolitical factors that influence an asset’s value.

Key Factors in Fundamental Analysis

  • Geopolitical Events:

Geopolitical events, like elections, trade deals, or conflicts, can cause turbulence in the financial markets. They play a role in shaping investors’ confidence and affecting asset prices. Keep an eye on global news and how it impacts the markets.

  • Economic Indicators:

Economic indicators are like clues that help you understand the health of a country’s economy. Key indicators include GDP (Gross Domestic Product), employment rates, inflation, and interest rates. When these indicators show a strong economic signal, asset prices might rise. But if they reveal weakness, prices could fall.

  • Company Performance:

If you’re trading CFDs on individual stocks, it’s essential to investigate the companies behind them. Look into their financial reports, earnings, and growth prospects. A company with solid earnings and exciting projects may attract more investors, boosting its stock price. But beware of companies facing challenges, their stock prices might take a dip.

Summary

Fundamental analysis is key to revealing the hidden treasures of the financial markets. It can help you understand the true value of assets and the factors that drive their prices. By combining fundamental analysis with technical analysis, you will be well-equipped to tackle the thrilling world of CFD trading.

Gold strengthened on bright retail sales numbers

Focus on gold.

Fundamentally speaking, the US released retail sales in July increased by 0.7% mom. The figure for June was also revised up to 0.3% from 0.2%, suggesting the U.S. economy continued to expand in 3Q and avoid recession. Consequently, inflation stays still in the short run.  With demand remaining resilient and labor market tightening, curbing inflation has become a tricky problem for the FED. We believe gold is heading for a bounce.

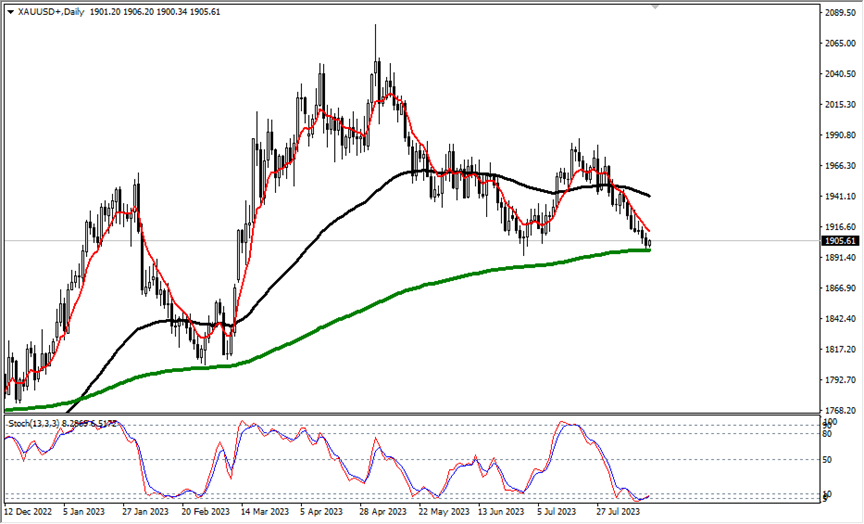
Technically speaking, the gold daily has come to a key support zone – the 240-day moving average .

(Gold daily cycle, Ultima Markets MT4)

The 240-day moving average has been a supportive position for gold since 2022. The gold price made small fluctuations in the supportive zone during the past week, nevertheless, the stochastic oscillator signaled a golden cross yesterday.

(Gold in 1- hour period, Ultima Markets MT4)

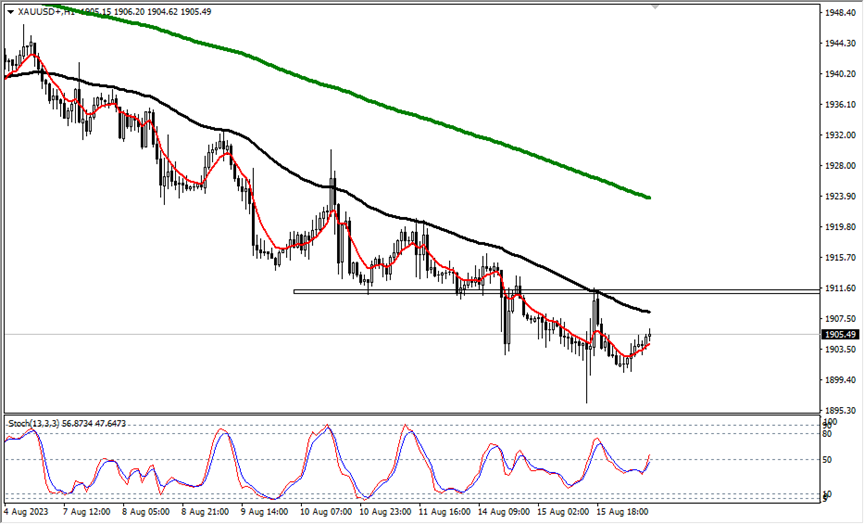
In 1-hour period, the gold price went down again after stepping back on the 65 – period moving average yesterday, but it did not fall below the previous low. Looking at the overall structure, the gold price has a probability of forming a bottom structure. After the price breaks through the previous suppressed position, please make sure if the ATR combination indicator shows an effective breakthrough.

(Gold in 1- hour cycle, Ultima Markets MT4)

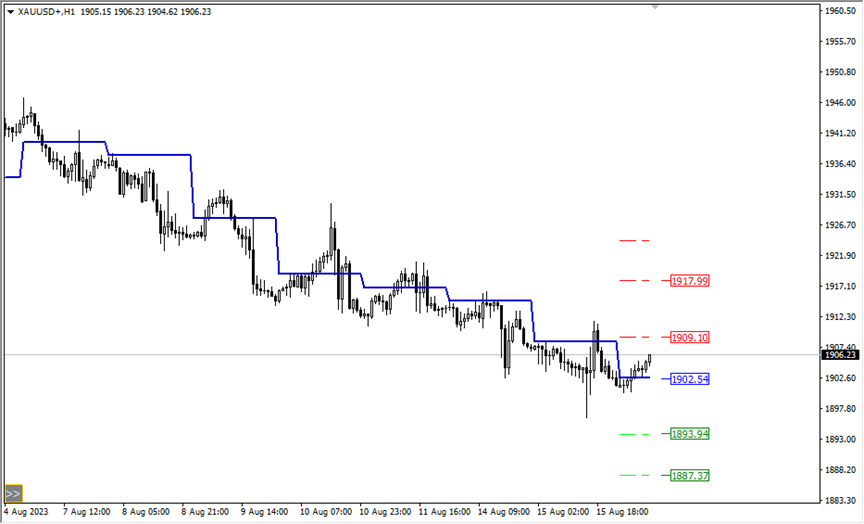
According to the pivot indicator in Ultima Markets MT4, the central price is 1902.54,

Bullish above 1902.54, the first target is 1909.10, and the second target 1917.99.

Bearish below 1902.54, the first target is 1893.94, and the second target 1887.37.

Disclaimer Comments, news, research, analysis, price, and all information contained in the article only serve as general information for readers and do not suggest any advice. Ultima Markets has taken reasonable measures to provide up-to-date information, but cannot guarantee accuracy, and may modify without notice. Ultima Markets will not be responsible for any loss incurred due to the application of the information provided.

3 Concepts in Forex Trading Key to Beginners

3 Basic Concepts in Forex Trading Key to Beginners

Forex trading can be complex for beginner investors if they don’t understand some basic concepts or elements. Except for margin and leverage mentioned in our previous article, “Understanding Margin and Leverage: Why Forex Trading May Boost Your Profits”, we are going to walk through another 3 basic elements key to forex trading in this article.

Pips & Spread

Pips are a way to measure the price movement of currency pairs in the forex market, while spread refers to the difference between the buying price and selling price of a currency pair.

Think of pips as the small units that represent changes in the value of a currency pair. Pips are usually displayed as the last decimal place in the exchange rate. For example, if the exchange rate of the EUR/USD currency pair moves from 1.2000 to 1.2010, it means it has moved 10 pips.

As for the spread, it’s the cost you pay to enter a trade. When you see a currency pair quote, it will show two prices: the higher ask or offer price and the lower bid price. The difference between these two prices is the spread.

Imagine you want to trade the USD/JPY currency pair, and the current quote is 110.50/110.55. In this case:

  • The bid price is 110.50, which means if you want to sell the currency pair, you will receive 110.50 Japanese yen for every US dollar.
  • The ask price is 110.55, which means if you want to buy the currency pair, you will have to pay 110.55 Japanese yen for every US dollar.

In this example, the spread is 5 pips, as the difference between the bid price (110.50) and the ask or offer price (110.55) is 5 pips.

Take Profit

Take profit and stop loss are two important tools used in forex trading to manage risk and protect trading positions. Let’s explain take profit first.

Take profit is a predetermined level at which you decide to close a trade and secure your profits. It’s like setting a target for your amount of profit you want to achieve from a trade. When the market reaches your specified take profit level, your trade is automatically closed to realize the profit.

Imagine you bought the EUR/USD currency pair at 1.2010, and you set your take profit at 1.2110. This means you aim to capture a profit of 100 pips. If the market moves up and reaches 1.2110, your trade will be closed automatically, limiting your profit to 100 pips.

Stop Loss

Stop loss is a predetermined level at which you decide to exit a trade to limit your potential losses. It’s like a bottom-line that protects your trades from significant drawdowns. When the market moves against your position and reaches your specified stop loss level, your trade is automatically closed to prevent further losses.

Continuing from the previous example, let’s say you also set a stop loss at 1.2050. This means you are willing to accept a maximum loss of 50 pips. If the market moves down and reaches 1.2050, your trade will be closed automatically, limiting your loss to 50 pips.

By using take profit and stop loss orders, you can manage your risks effectively, protect your investment, and maintain a consistent and disciplined approach to forex trading.

Summary

  • Pips are a way to measure the price movement of currency pairs in the forex market, while spread refers to the difference between the buying price and selling price of a currency pair.
  • Take profit is a predetermined level at which you decide to close a trade and secure your profits, resembling a target for your amount of profit you want to achieve from a trade.
  • Stop loss is a predetermined level at which you decide to exit a trade to limit your potential losses, resembling a bottom-line that protects your trades from significant drawdowns.

Spread between Europe and the US pressed on the euro

Focus on EUR/USD.

Fundamentally speaking, although Fed’s rate hike coming to an end, the U.S. dollar index continues to rise. According to data released by the CFTC last week, the short positions fell to the lowest level in eight weeks. Short-covering is fueling a rebound in the U.S. dollar index as hedge funds continue to trim their short positions.

(US 10 -Year Treasury Yield vs EU 10 -Year Treasury Yield)

During the tightening monetary cycle, the spread of long-term bonds between the United States and Europe drives arbitrage funds to buy dollar and sell euro. In the short term, the spread deliveries adjustments to the exchange rate.

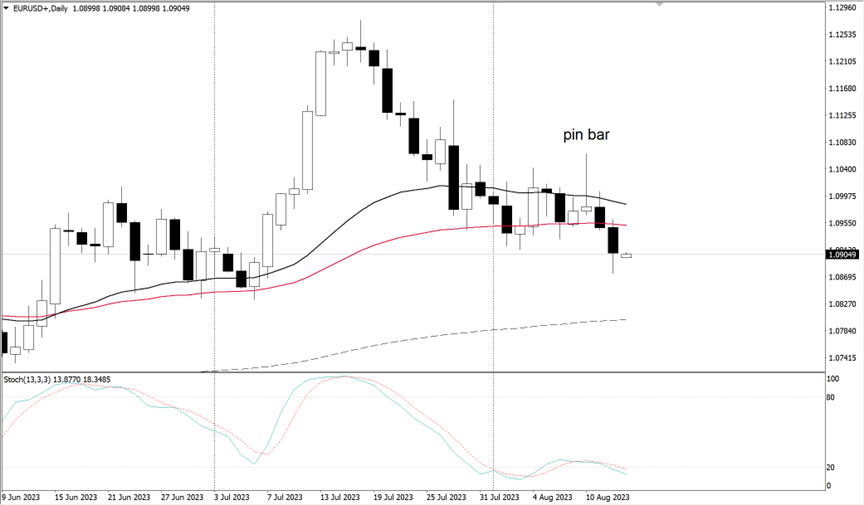
Technically speaking, the EUR/USD daily cycle completed a breakout of last Friday’s low yesterday. The market has a high probability of ushering in a downward trend in the next two days.

(EUR/USD daily cycle, Ultima Markets MT4)

The exchange rate fell below multiple moving averages and was blocked by the 61.8% golden ratio Fibonacci retracement position yesterday. Today there is a certain probability of stepping back on the moving average or consolidating prices, but if today’s market continues to fall below yesterday’s low, the euro will remain weak against the dollar.

(EUR/USD daily cycle, Ultima Markets MT4 )

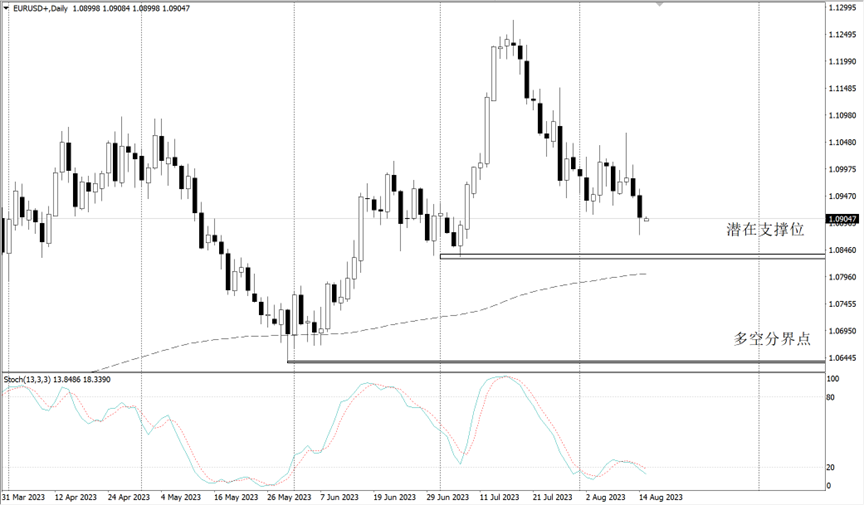
From the perspective of daily structure, there are two key support positions below the level, 1.0836 is the potential target, and 1.0639 is the extremely critical long-short boundary. If all supportive levels are crushed, a deep correction will come along.

(EUR/USD in 4 -hour cycle, Ultima Markets MT4)

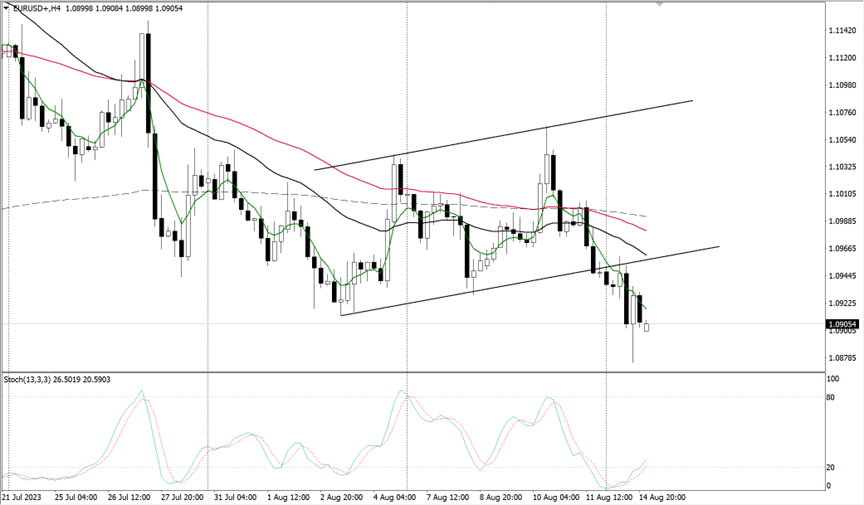
In 4- hour cycle, bull and bear are in entanglement. The Stochastic Oscillator displays a golden cross to indicate the bull, but the exchange rate maintains a downward trend. It means that the decline is not firm enough, and the rebound is still strong.

(EUR/USD in 1- hour cycle, Ultima Markets MT4)

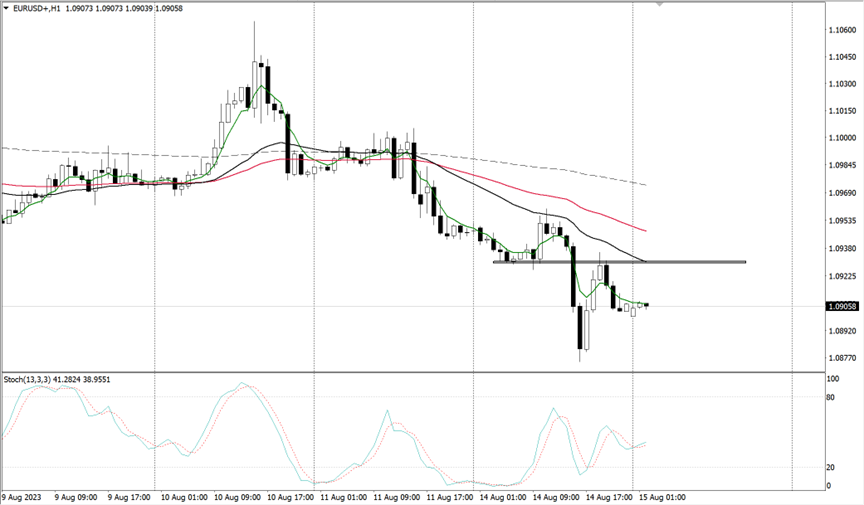
In 1- hour cycle, the price still has the probability of stepping back on the moving average and resistance level. If Stochastic Oscillator shows a dead cross later on, please look for short trading opportunities.

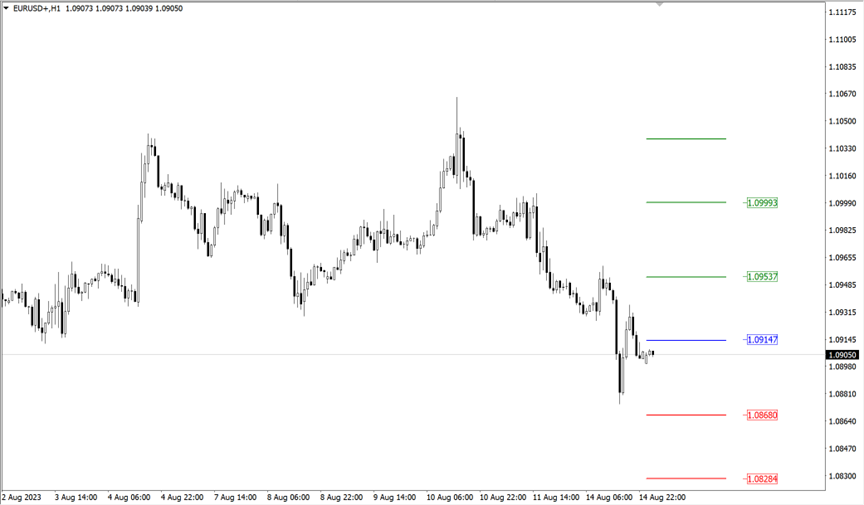
According to the pivot indicator in Ultima Markets MT4, the central price is 1.09147,

Bullish above 1.09147, the first target is 1.09537, and the second target 1.09993.

Bearish below 1.09147, the first target is 1.08680, and the second target 1.08284.

Disclaimer

Comments, news, research, analysis, price, and all information contained in the article only serve as general information for readers and do not suggest any advice. Ultima Markets has taken reasonable measures to provide up-to-date information, but cannot guarantee accuracy, and may modify without notice. Ultima Markets will not be responsible for any loss incurred due to the application of the information provided.

Seeing clear sky if euro breaks through

Focus on EUR/USD.

On fundamentals, last week PMI figures in the euro zone reconfirmed the pressure on the European economy, with the manufacturing sector recording 42.7 in July, the lowest manufacturing PMI since 2020. The PMI for the services sector was revised down to 50.9 in July, the lowest up to date. In this context, the market’s expectation for the end of the ECB interest rate hike has fallen from the high of 3.95% in July to the current 3.8%. Investors can wait for the market to digest the interest rate difference between Europe and the United States, and then pay attention to the impact of more economic data on the future.

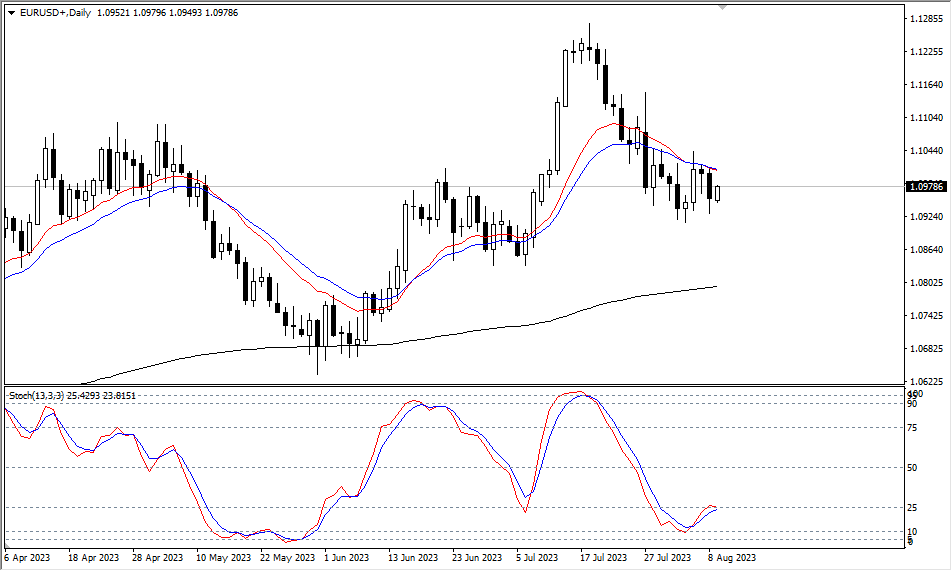
Technically speaking, in EUR/USD daily cycle, the short-term moving averages formed by the 15-day and 21-day suppressed the rise of the exchange rate in the short run. Although it fell below Monday’s low yesterday, there are still bullish opportunities.

(EUR/USD daily cycle, Ultima Markets MT4)

The stochastic oscillator formed a golden cross gesture last week, and there is a bullish potential, but it can only be clarified after the suppression of the short-term moving averages reverses.

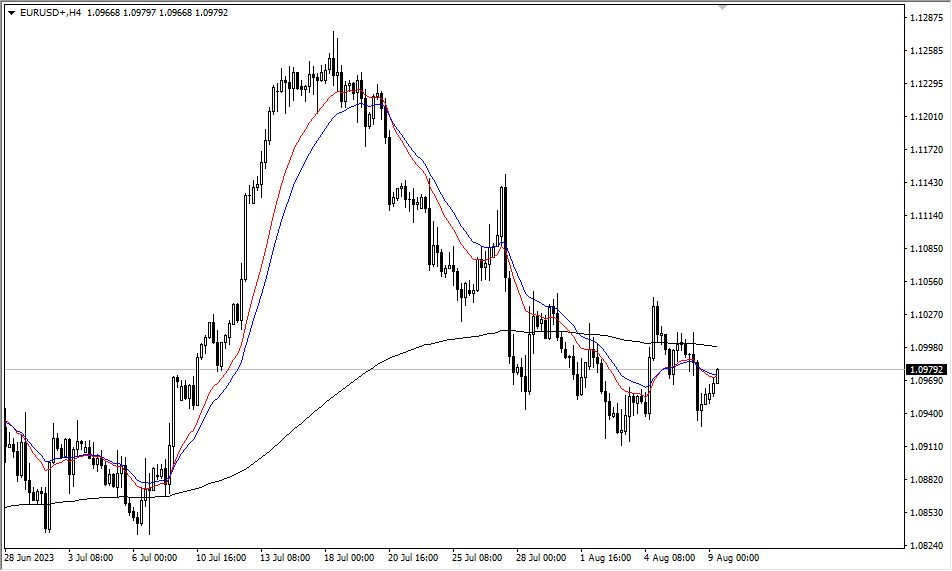
(EUR/USD 4 -hour cycle, Ultima Markets MT4)

In the 4- hour cycle, the exchange rate doesn’t form an effective long structure, and still needs to wait for the confirmation of moving averages and price actions. It is necessary to watch out for any bearish strike in the short term.

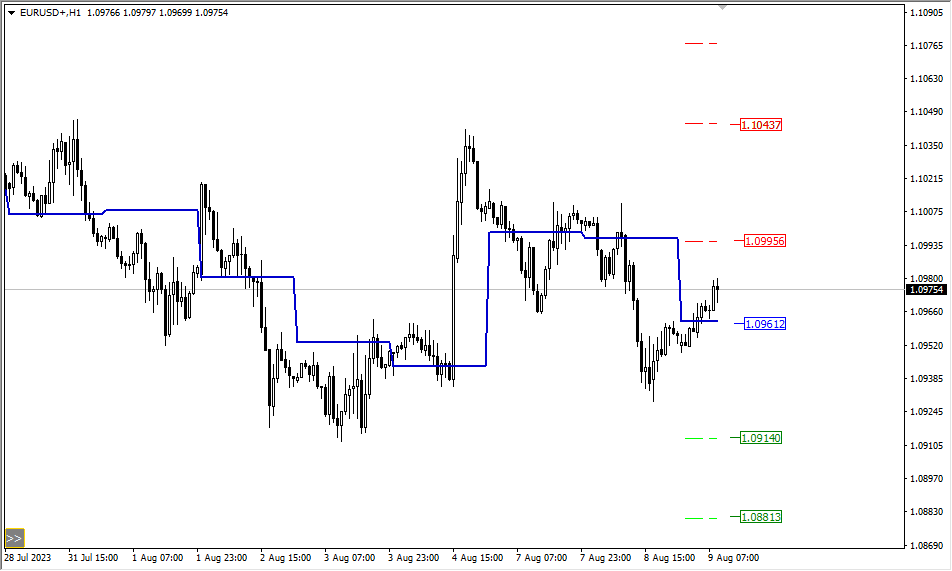
(EUR/USD 1 -hour cycle, Ultima Markets MT4)

According to the pivot indicator, the central price of the day is 1.09612,

Bullish above 1.09612, the first target is 1.09956, and the second target 1.10437.

Bearish below 1.09612, the first target is 1.09140, and the second target 1.08813.

Disclaimer

Comments, news, research, analysis, price, and all information contained in the article only serve as general information for readers and do not suggest any advice. Ultima Markets has taken reasonable measures to provide up-to-date information, but cannot guarantee accuracy, and may modify without notice. Ultima Markets will not be responsible for any loss incurred due to the application of the information provided.

GBP/AUD looks out for bears

Focus on GBP/AUD today.

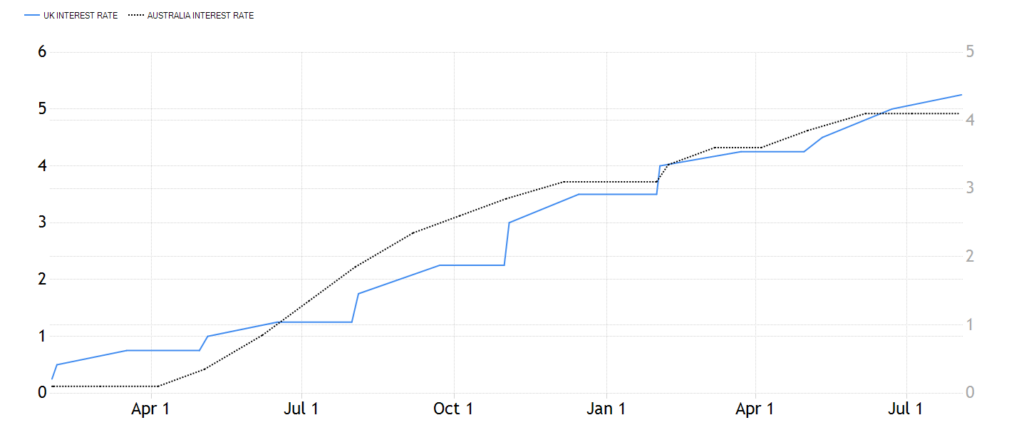
On fundamentals, there is no notable financial data due today. The difference in monetary policy between the UK and Australia will control the currency exchange rate in the short run.

(Blue vs Black, BoE rate vs RBA rate)

The BoE raised its benchmark interest rate by 25 bps to the highest level of 5.25% since 2008. At the same time, the RBA’s is currently set at 4.1%. The interest rate differential means room for arbitrage. AUD is deemed as a commodity currency, inherently vulnerable to commodity prices. The market is positive about RBA rate hikes, resulting in a bullish view of AUD.

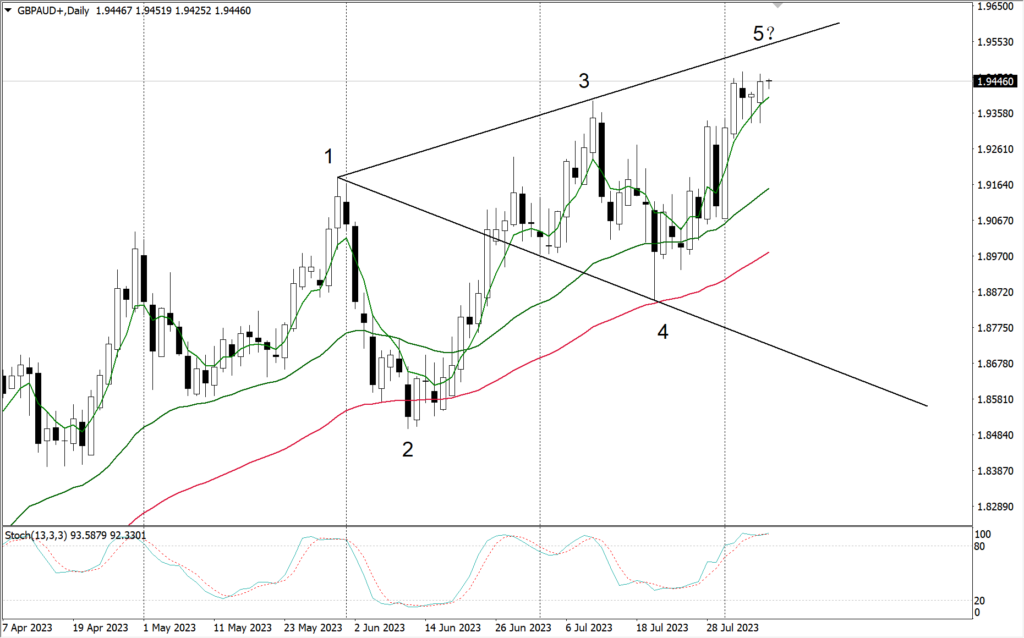
Technically speaking, the GBP/AUD daily cycle structure presents a potential Wolf Wave structure. However, the current price action structure does not show a clear bearish structure.

(GBP/AUD daily cycle, Ultima Markets MT4)

The daily price action has room to rise — support is found on the 33-day moving average. The exchange rate fluctuated on the 5-day moving average for three days and stopped falling with three lower shadows. Still, we need to be alert. The stochastic oscillator has been entangled, and the upper resistance line is not far away. The market may reverse at any time.

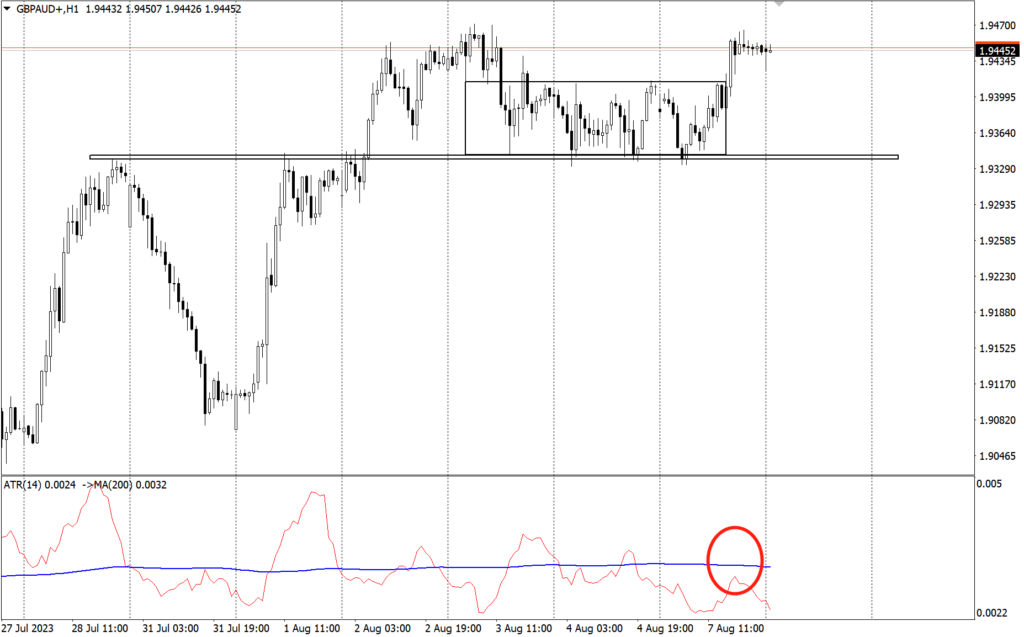
(GBP/AUD 1 -hour cycle, Ultima Markets MT4)

On the hourly chart, GBP/AUD has formed a clear rectangular range after three days of swinging. Yesterday’s breakthrough suggested that bulls are more dominant in the short run. However, judging from the ATR combination indicators, it is doubtful whether the market breakthrough is effective. From a technical standpoint, GBP/AUD looks bullish, however, the sentiment may quickly change.

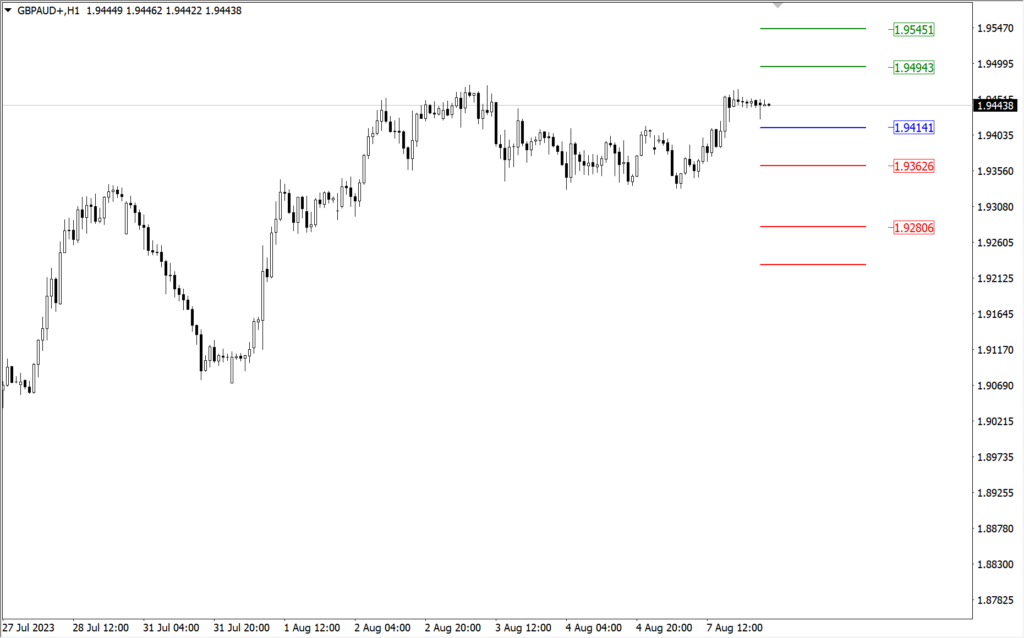
(GBP/AUD 1- hour cycle, Ultima Markets MT4)

According to the pivot indicator in Ultima Markets MT4, the central price of the day is 1.94141,

Bullish above 1.94141, the first target is 1.94943, and the second is 1.95451.

Bearish below 1.94141, the first target is 1.93626, and the second is 1.92806.

Disclaimer

Comments, news, research, analysis, price, and all information contained in the article only serve as general information for readers and do not suggest any advice. Ultima Markets has taken reasonable measures to provide up-to-date information, but cannot guarantee accuracy, and may modify without notice. Ultima Markets will not be responsible for any loss incurred due to the application of the information provided.

GBP/AUD changing game is on

Focus on GBP/AUD today.

On Fundamentals, BoE raised its benchmark interest rate by 25 bps yesterday, reaching the highest level since 2008. Rising interest rates mean higher borrowing costs, meaning more pressure on many homeowners. The UK continues to be on the edge of recession. Separately, RBA’s monetary report suggests suspending interest rate hikes, however, leaves room for another 15-bps raise.

BoE’s monetary policy was significantly more hawkish than RBA’s, resulting in an appreciation of GBP/AUD since February 2023. However, BoE’s policy no longer brought bullish sentiment on the pound but worries on the British outlook. At present , the market is certian on the future peak interest rate of the RBA, which will lead to a potential bullishness on the Australian dollar .

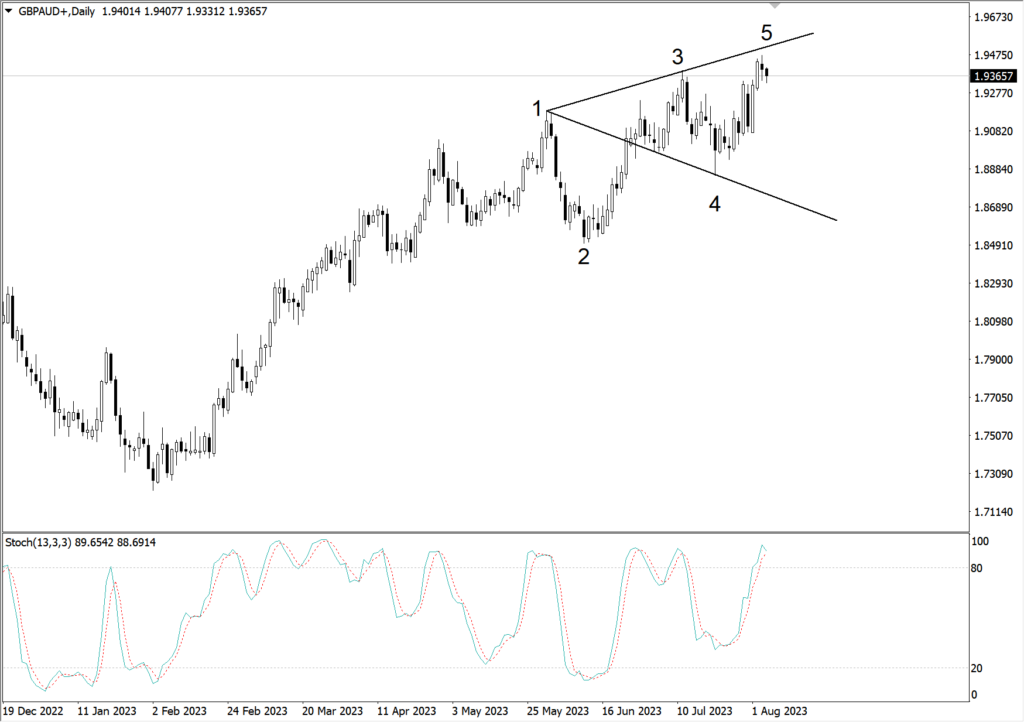
Technically speaking, the GBP/AUD daily cycle presents a potential Wolf Wave structure, but the price action structure does not display a clear bearish signal at moment.

(GBP/AUD daily cycle, Ultima Markets MT4)

The Stochastic Oscillator shows no dead cross on the daily cycle. Please be aware of GBP/JPY’s next bullish trend.

(4-hour GBP/AUD cycle, Ultima Markets MT4 )

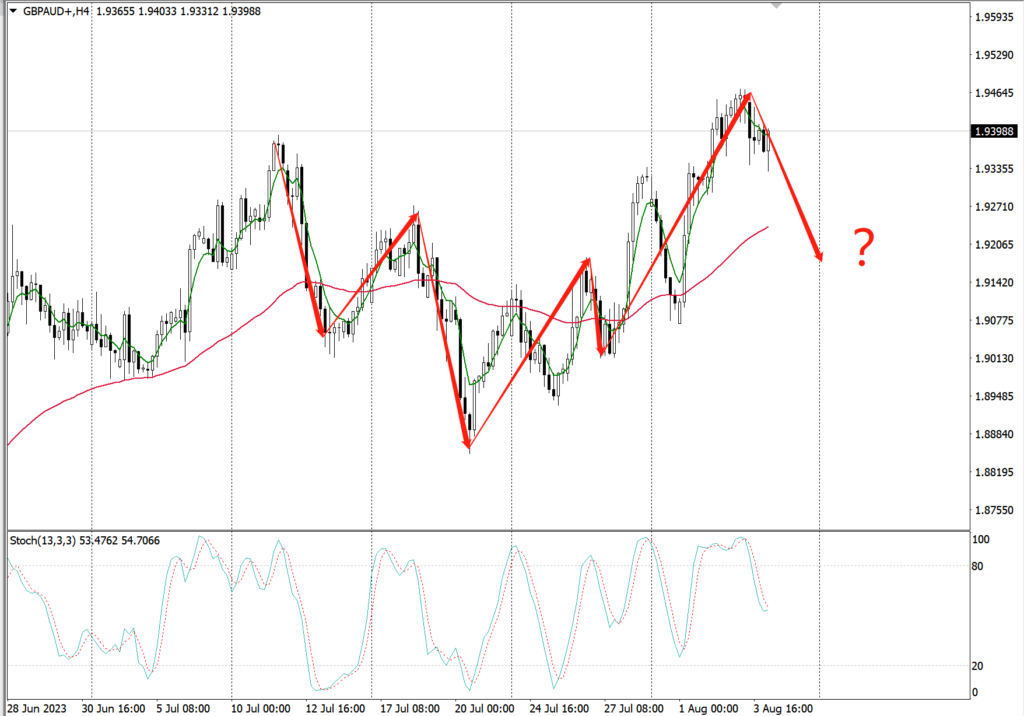
The 4-hour Elliott Wave structure of GBP/AUD suggests that it may be in a double-saw-tooth rebound phase. After the market confirms the bearish trend, it is possible to pave a sharp downward path.

(1-hour GBP/AUD cycle, Ultima Markets MT4)

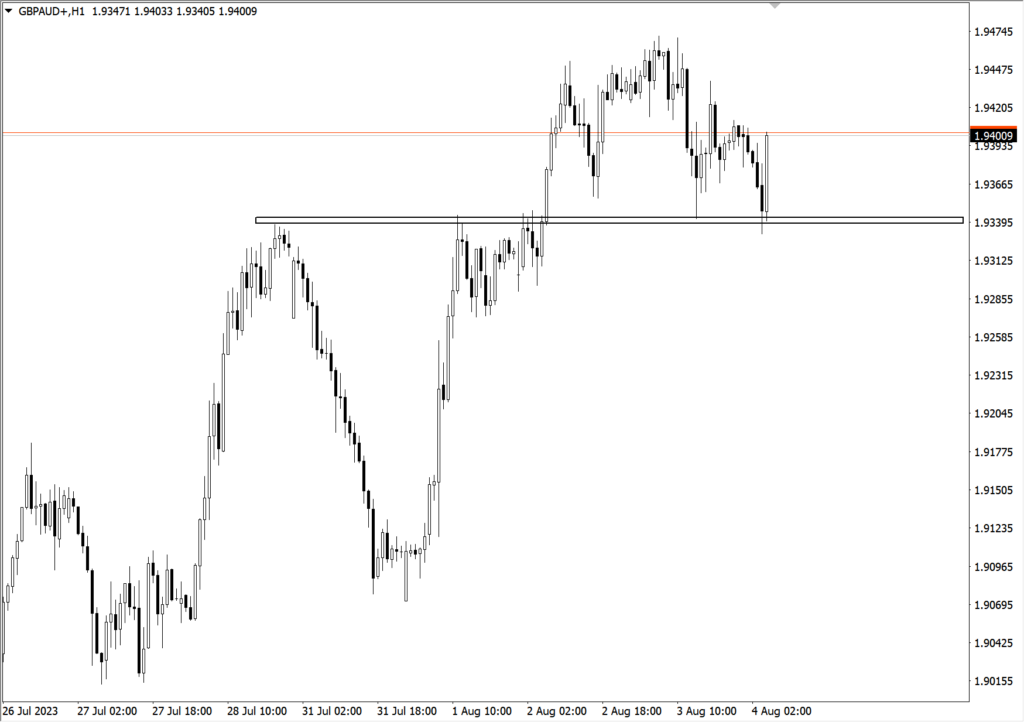
On 1-hour cycle of GBP/AUD, a turning point emerged. The exchange rate fell rapidly and was close to the previous breakthrough price. On August 2, the price action formed a potential head-and-shoulders structure. If it falls below the 1.9338 neckline, the probability of going bearish will increase.

(1- hour GBP/AUD cycle, Ultima Markets MT4)

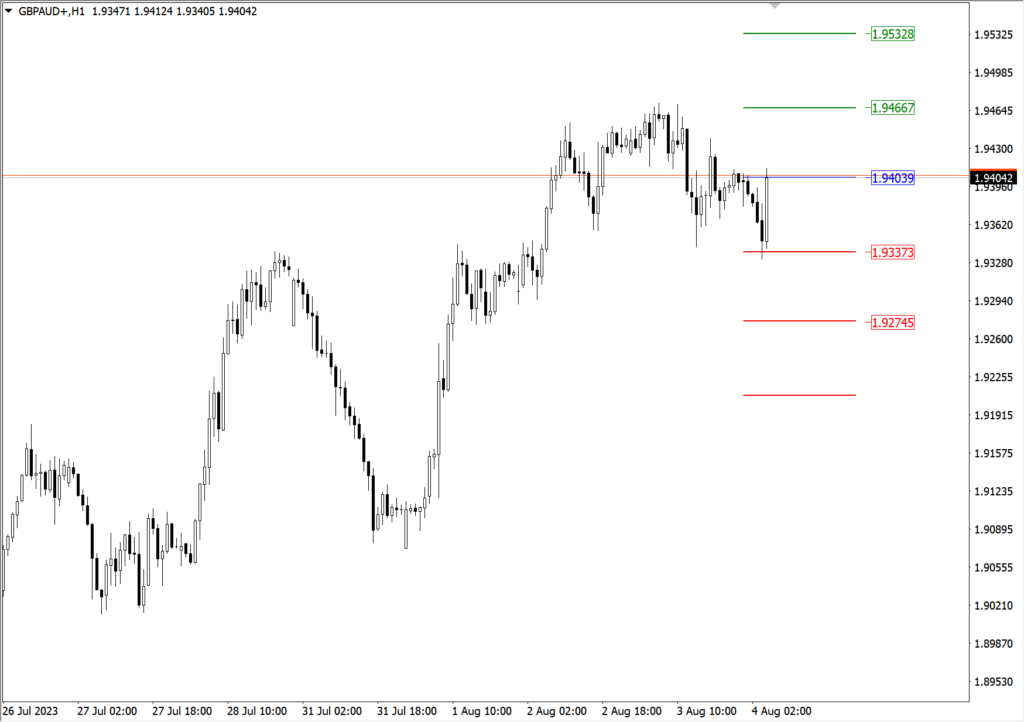
According to the pivot indicator in Ultima Markets MT4 , the central price of the day is 1.94039 ,

Bullish above 1.94039, the first target is 1.94667, and the second is 1.95328.

Bearish below 1.94039, the first target is 1.93373, and the second is 1.92745.

Disclaimer

Comments, news, research, analysis, price, and all information contained in the article only serve as general information for readers and do not suggest any advice. Ultima Markets has taken reasonable measures to provide up-to-date information, but cannot guarantee accuracy, and may modify without notice. Ultima Markets will not be responsible for any loss incurred due to the application of the information provided.

GBP rides on Wolfe Wave

Focus on GBP/USD today.

Fundamentally speaking, the BoE and Fed are heading for a showdown now, and this is the only factor that affect the exchange rate between the two. First, the BoE tightening policy has not yet been clarified, While the Fed’s rate hike has come to an end. Second, although the probability of the Fed’s raising rates in 2023 has decreased, any positive economic data may trigger Fed’s move again, resulting in an elevated USD.

Before the BoE’s MPC meeting and the US’s nonfarm payrolls due this week, the GBP/USD is dominated by market sentiment in the short run. It is necessary to alert of any technical breakthrough.

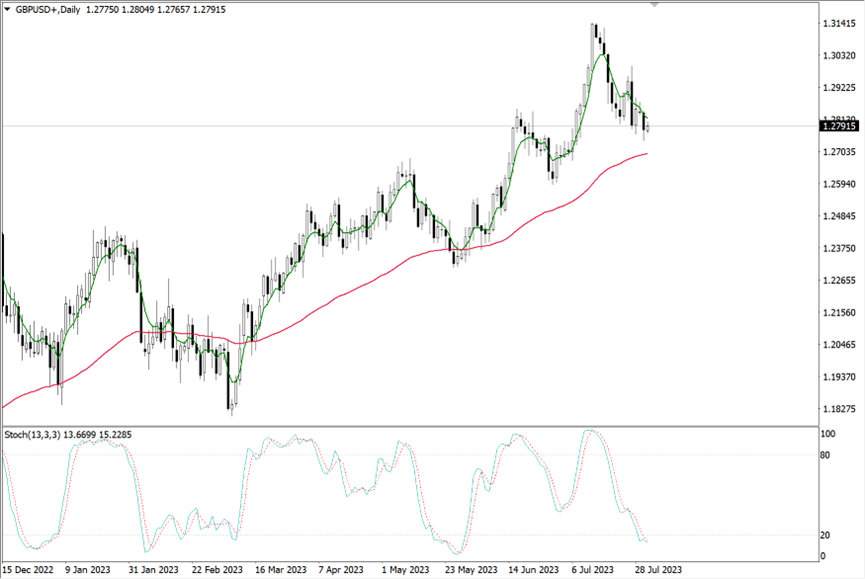
Technically speaking, the GBP/USD daily cycle is about to approach the 65- day moving average, and the stochastic oscillator has also entered the oversold zone.

(GBP/USD daily cycle, Ultima Markets MT4)

It is still too early to say that the bear is gone for GBP, so you must stay alert.

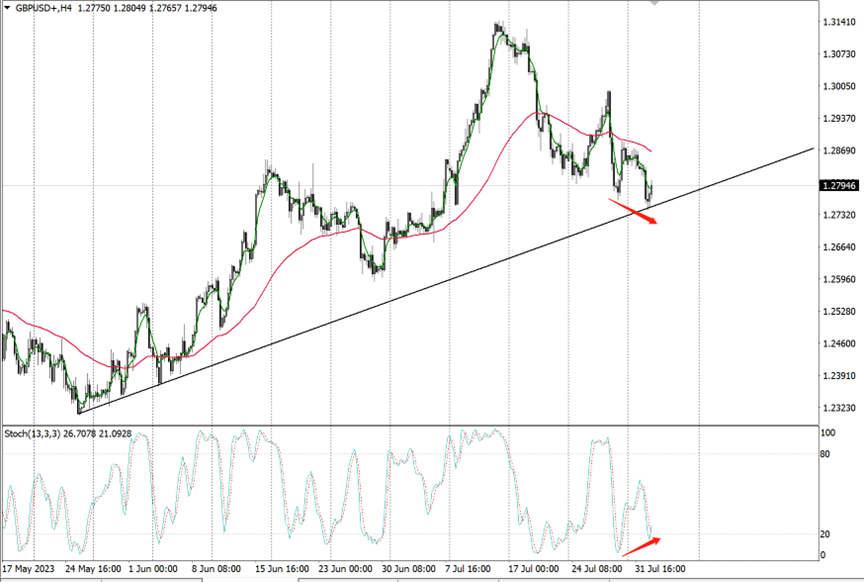
(GBP/USD 4 -hour cycle, Ultima Markets MT4)

In the 4- hour period, the exchange rate has fallen to the upward trend line, while the stochastic oscillator indicator shown divergence signals. As a result, a short-term rebound is expected.

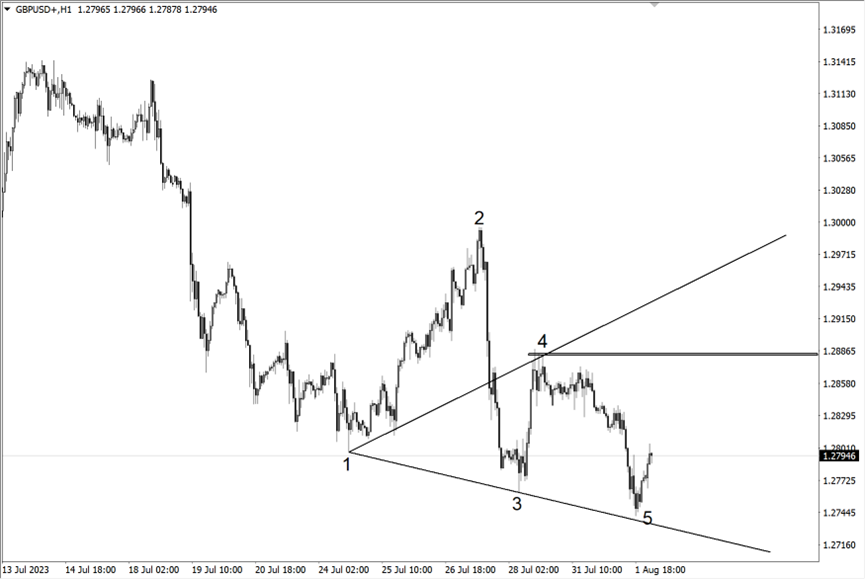
(GBP/USD in 1- hour period, Ultima Markets MT4)

In 1- hour period, the price action shows a clear Wolfe wave pattern. Point 3 is below point 1, as point 4 retreats to the price range between point 2 and point 3, and point 5 rebounds upward after falling to the line connecting point 1 and point 3. In the short term, GBP/USD has a certain chance of rebounding. The first target looks at the level of point 4, and the second target looks at  line connecting point 1 and point 4 .

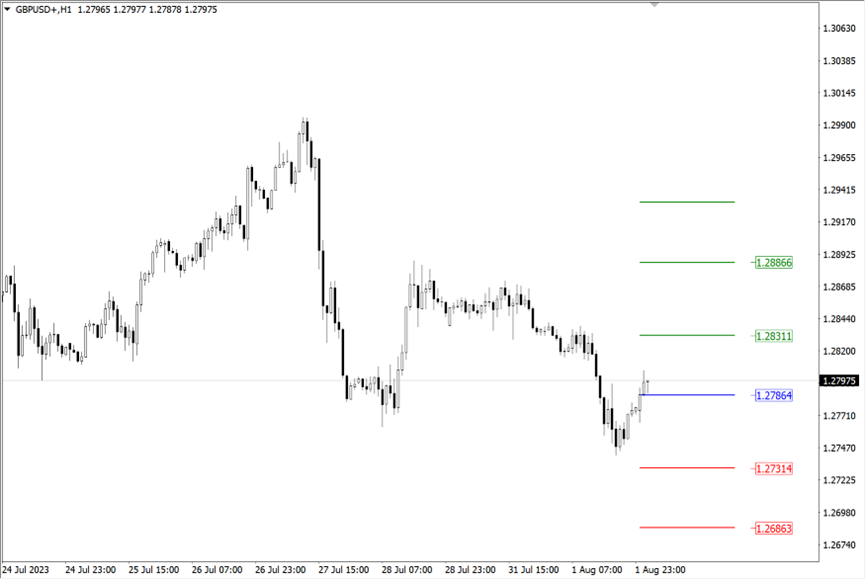
(GBP/USD in 1- hour period, Ultima Markets MT4)

According to the pivot indicator in Ultima Markets MT4, the central price is 1.27864,

Bullish above 1.27864, the first target is 1.28311, and the second target 1.28866.

Bearish below 1.27864, the first target is 1.27314, and the second target 1.26863.

Disclaimer

Comments, news, research, analysis, price, and all information contained in the article only serve as general information for readers and do not suggest any advice. Ultima Markets has taken reasonable measures to provide up-to-date information, but cannot guarantee accuracy, and may modify without notice. Ultima Markets will not be responsible for any loss incurred due to the application of the information provided.