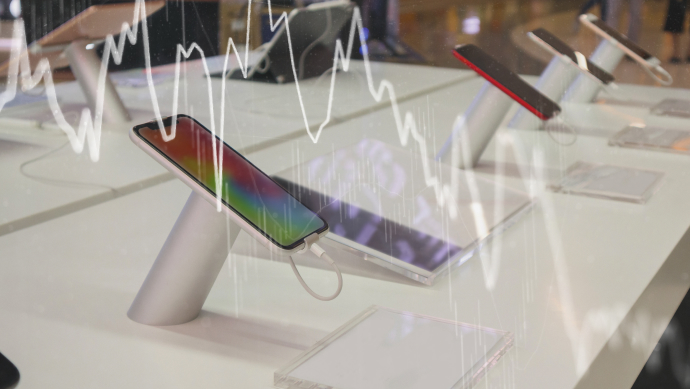
Global Mobile Phone Production Decline in 2H23: Insights and Analysis
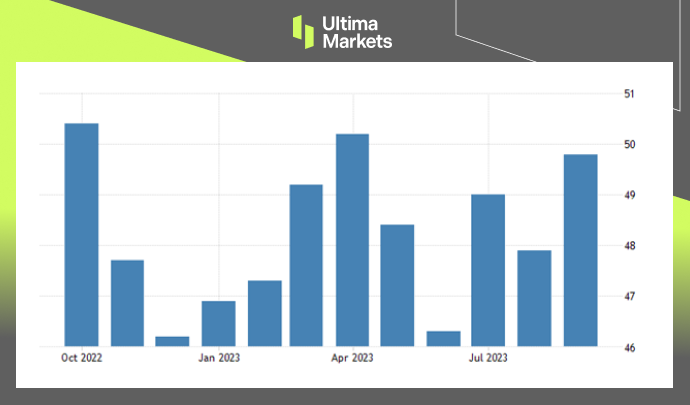
According to a TrendForce survey, after global smartphone production fell by nearly 20% year-on-year in the first quarter, production continued to decline by approximately 6.6% in the second quarter, to only 270 million units.
A total of 520 million smartphones were produced in the first half of 2023, a 13.3% decline compared to the same period last year. Both individual quarters and the first half of the year in total set a ten-year low.
Factors Influencing Mobile Phone Production Decline
There are three reasons for the sluggish production performance:
1. China’s lifting of epidemic prevention restrictions has not boosted demand as expected.
2. The demographic dividend effect of the emerging Indian market has not effectively exerted its advantages.
3. In 2022, brand names were severely hampered by excessive channel inventory. It was originally expected that as the inventory reduced, brand names would have returned to normal production levels. However, affected by the weak economy, people’s consumption willingness is more conservative, resulting in production performance in the first half of the year being less than expected.
Top Six Global Smartphone Brands Challenges and Channel Inventory
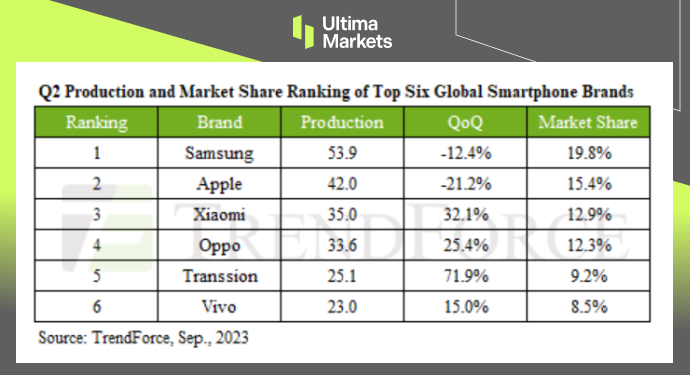
(2Q23 global smartphone production and market share ranking)
Samsung’s production performance in the second quarter was not as good as the same period last year. The total production in the second quarter was 53.9 million units, a quarter-on-quarter decrease of 12.4%, but it still ranked first in production.
Apple is facing the transition of new and old models. The second quarter is probably the lowest production performance among the four quarters, with output of 42 million units, a quarter-to-quarter decrease of 21.2%. It is worth noting that Samsung and Apple are quite close in their full-year production forecasts. If the iPhone 15 series performs better than market expectations, it may overtake Samsung to become the number one brand in the global market.
Xiaomi’s output in the second quarter was approximately 35 million units, a quarterly increase of 32.1%, driven by the gradual decline in channel inventory and the launch of new models.
A special change in the ranking is that Transsion overtook Vivo and entered fifth place in the world for the first time. Its production volume increased by more than 70% quarter-on-quarter to 25.1 million units.
Outlook for the Global Smartphone Market
The overall economy has not fully recovered in the second half of the year, and demand in consumer markets such as China, Europe and the United States has not yet recovered significantly. Even if the economic indicators of the Indian market improve, it is still difficult to reverse the decline in global smartphone production.
Disclaimer
Comments, news, research, analysis, price, and all information contained in the article only serve as general information for readers and do not suggest any advice. Ultima Markets has taken reasonable measures to provide up-to-date information, but cannot guarantee accuracy, and may modify without notice. Ultima Markets will not be responsible for any loss incurred due to the application of the information provided.