FOMC meeting minutes published
The U.S. Federal Reserve released the minutes of its September meeting on the 11th. To bring inflation back to the 2% target, maintaining a restrictive monetary policy is key. Most officials judged that it may be appropriate to raise interest rates again at future meetings. Some, however, believed that further interest rate hikes were not necessary. The minutes of the meeting also pointed out that the U.S. economy is expanding at a stable pace and the labor market is gradually reaching balance. However, inflation continues to be higher than the Federal Reserve’s target. Federal Reserve officials estimate that economic growth must fall below 1.8% to allow the trend of rising prices to be eased.
Sep. PPI increased 0.5% MoM
The U.S. Bureau of Labor Statistics also released inflation data. Producer prices in the US rose 0.5% month-over-month in September 2023, the least in three months, following a 0.7% rise in August, but above market forecasts of 0.3%. Goods prices were up 0.9%, prompted by a 5.4% surge in gasoline cost.
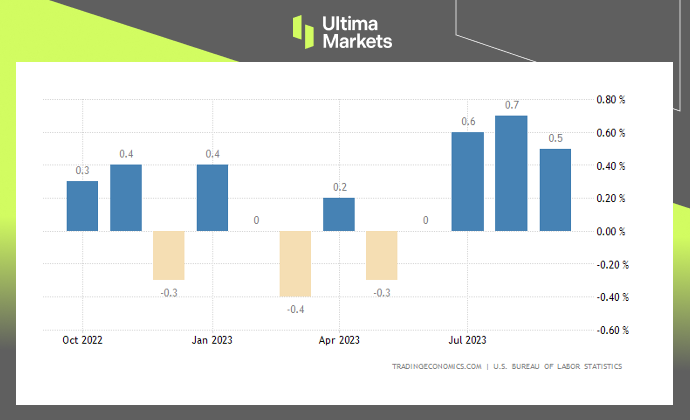
(PPI MoM , U.S. Bureau of Labor Statistics)
Sep. Core PPI increased 0.3% MoM
Core producer prices in the United States were up by 0.3% over the previous month in September of 2023, following a 0.2% rise in the previous month and slightly above market expectations of a 0.2% increase. On a yearly basis, core consumer prices advanced by 2.7%, after an upwardly revised 2.5% rise in August and surpassing market estimates of a 2.3% increase, which might prompt the Federal Reserve to keep interest rates elevated for an extended period.
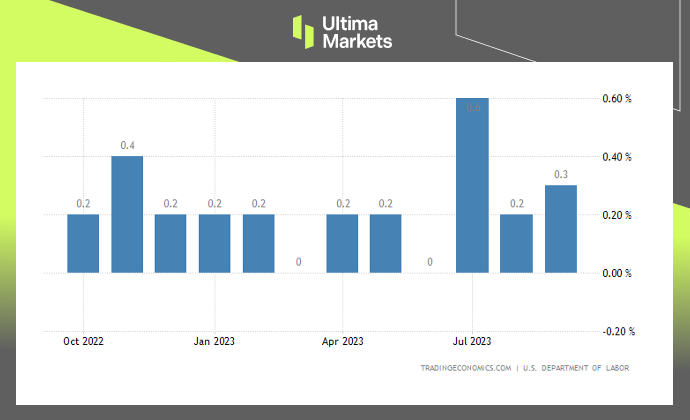
( Core PPI MoM , US Bureau of Labor Statistics)
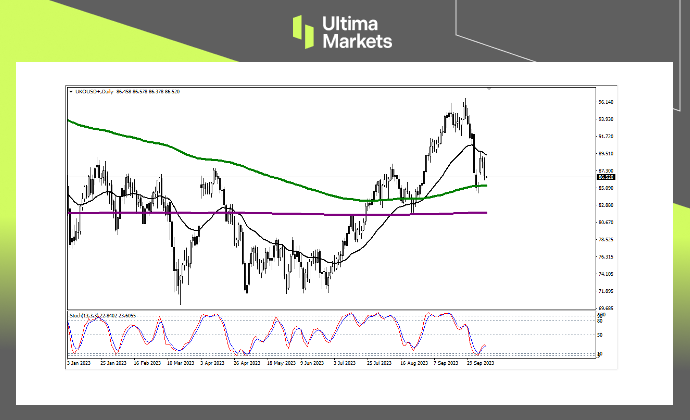
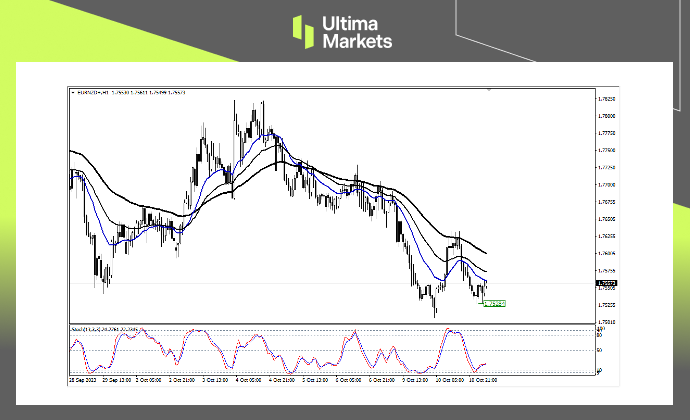
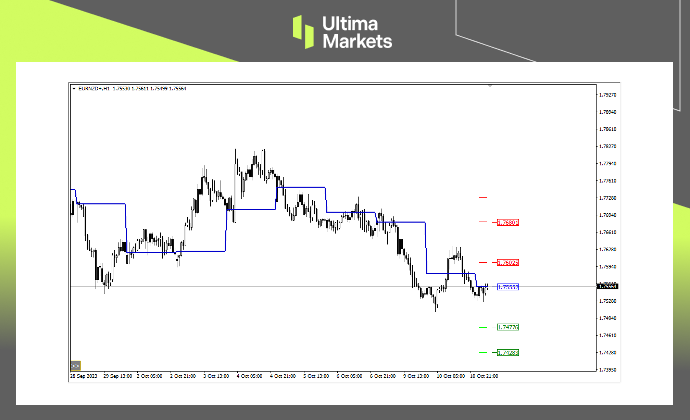
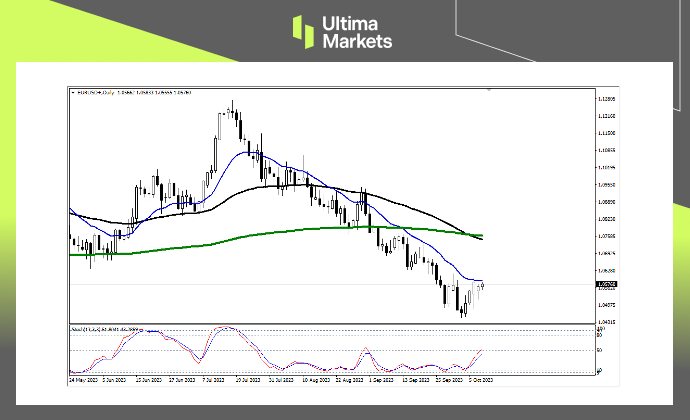
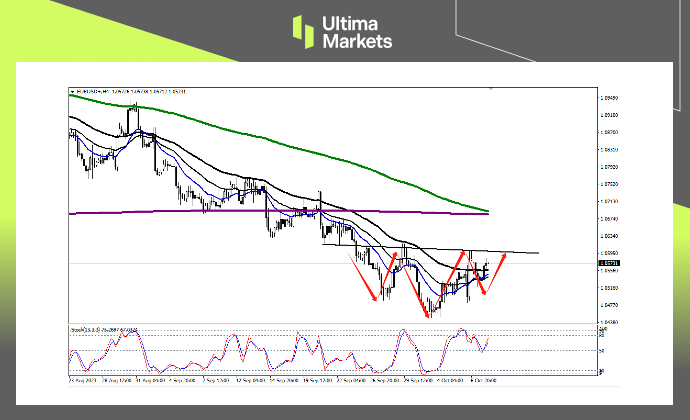
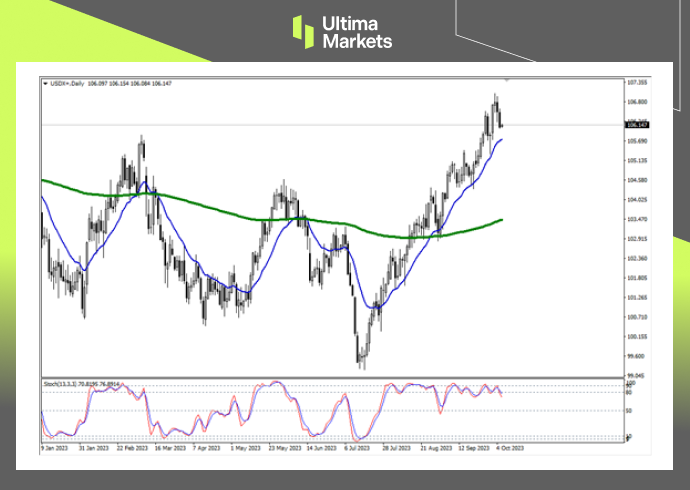
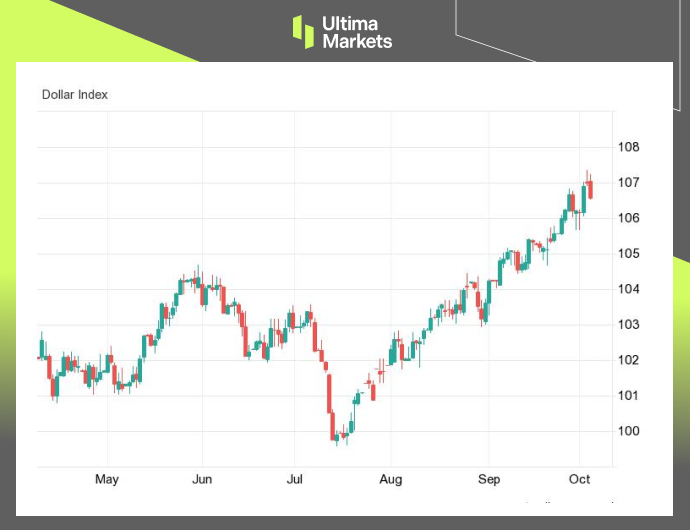
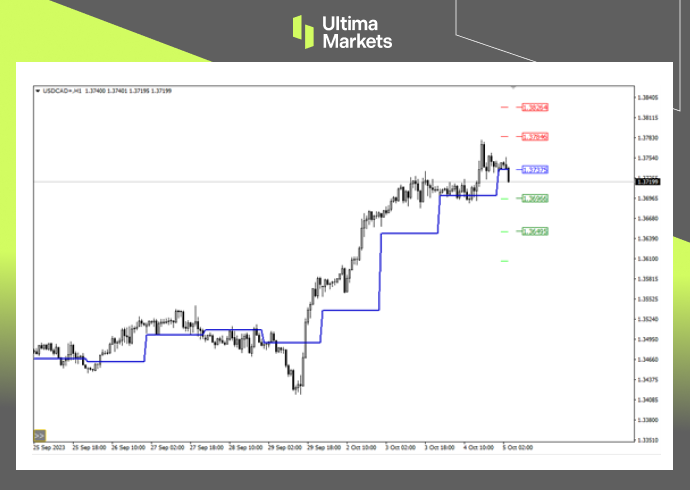
Rising bond yields could reduce expectations for rate hikes
FOMC has raised its benchmark interest rate 11 times to a target range of 5.25% to 5.5%, a 22-year high. Treasury yields have been rising sharply after the last meeting. If the situation persists, rising yields could eliminate the need for another rate hike.
Disclaimer
Comments, news, research, analysis, price, and all information contained in the article only serve as general information for readers and do not suggest any advice. Ultima Markets has taken reasonable measures to provide up-to-date information, but cannot guarantee accuracy, and may modify without notice. Ultima Markets will not be responsible for any loss incurred due to the application of the information provided.