Global Upstream Exchange Technical Disruption – Impact on Selected Products

Dear Valued Client,

Due to abnormal liquidity conditions in gold caused by this disruption, we have temporarily suspended trading for all gold instruments with immediate effect.

We are writing to keep you fully informed that a technical disruption currently affecting upstream global exchange, which has resulted in interruptions to pricing and trading for several international derivatives markets.

Please be advised that this is an industry-wide incident originating from an external provider and is unrelated to our platform or price movements.During this time, clients may experience price delays, order rejections, or temporary constraints on order execution.

We understand that seamless execution is vital to your trading. We have activated our emergency monitoring protocols and are tracking the recovery progress in real-time. We will send a follow-up notification immediately once services are fully operational.

We sincerely apologize for the inconvenience caused by this external event, and our support team remains on standby to assist you should you require any assistance.

Thank you for your understanding.

Close Pop-up

The Surge of Bitcoin: A Phenomenal October Rally


The Bitcoin ETF Hype

In October, cryptocurrency prices increased significantly, especially for bitcoin. Bitcoin had its biggest monthly hike since January.

Investors were excited about the possibility that bitcoin exchange-traded funds (ETFs) may soon be approved in the United States. ETF offers easy and affordable access for the average investor as compared to investing in cryptocurrency itself or existing products. 


The Bitcoin ETF Revolution

Simplifying Crypto Investments

Bitcoin ETFs, once approved, have the power to reshape the way individuals engage with cryptocurrencies. They present a user-friendly and cost-effective means for the average investor to participate in the digital asset realm.

Unlike the traditional method of direct cryptocurrency investment, which can be complex and intimidating, Bitcoin ETFs provide a structured and approachable entry point.

Mainstream Legitimacy

The impending approval of Bitcoin ETFs heralds a new era of legitimacy for cryptocurrencies. These ETFs bridge the gap between traditional financial markets and the crypto space, bringing credibility to the forefront. With the backing of mainstream financial institutions, Bitcoin’s status as a viable investment asset is reinforced.


The Ripple Effect

Broad Market Growth for Bitcoin

The surge in Bitcoin’s price triggered a ripple effect throughout the cryptocurrency market. The CoinDesk Market Index (CMI), tracking various tokens, recorded an impressive 22% growth during October. This upswing signifies a prevailing bullish sentiment, injecting confidence into the crypto landscape.

Bitcoin Market Capitalization Soars

TradingView data reveals that the total market capitalization of all cryptocurrencies soared by nearly 19%, reaching a substantial $1.255 trillion. This surge represents the most significant increase in crypto wealth since January, underlining the market’s resilience and growth potential.

Bitcoin/US Dollart One-month Chart By Ultima Markets MT4

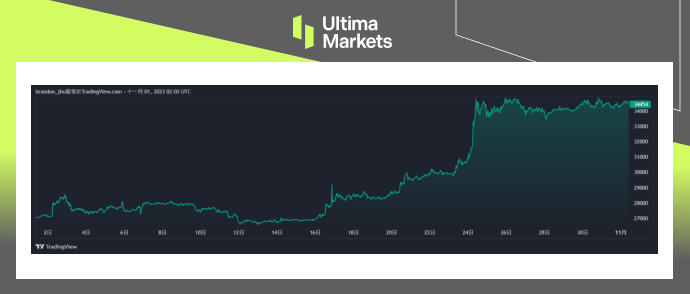
(BTCUSD One-month Chart)


Bitcoin’s Outstanding Performance

Bitcoin’s Ascendancy

Bitcoin (BTC), the pioneer of cryptocurrencies, outperformed its peers during this remarkable rally. BTC advanced by more than 27%, achieving a 17-month high of $35,000. This surge followed a period during which it traded around $27,000 in the early weeks of October. Currently, Bitcoin maintains its position above $34,000, as investors eagerly await the Federal Reserve’s interest rate decision.

Confidence in Bitcoin

Bitcoin’s impressive performance during this surge underscores its appeal to investors worldwide. Its stability above $34,000 signals growing confidence in Bitcoin as a long-term store of value and investment asset.


Conclusion

The surge of Bitcoin in October 2023 was nothing short of phenomenal, fueled by the prospects of Bitcoin ETF approval in the United States. This surge not only transformed Bitcoin but had a cascading effect on the broader cryptocurrency market. It showcased resilience, promise, and Bitcoin’s enduring position as a prominent player in the digital asset landscape.

The cryptocurrency market is still changing as time goes on. The forthcoming introduction of Bitcoin ETFs into traditional financial markets marks a significant turning point, providing investors of all stripes with accessibility, legitimacy, and a wide range of investment options.


Focus on EUR/USD Today – 1st November 2023 


Comprehensive EUR/USD for November 1, 2023

In this comprehensive analysis, Ultima Markets brings you an insightful breakdown of the EUR/USD for 1st November 2023. 


Key Takeaways 

  • ECB monetary policy: The latest interest rate decision of the European Central Bank has chosen to suspend interest rate hikes, it is the first time since July 2022.  As expectations for the suspension of interest rate hikes have been generally reflected in the markets, short-term volatility in Europe and the United States will be modest.
  • Economic outlook for the Eurozone: The manufacturing industry in the Eurozone continues to decline, the service industry is weak, demand is sluggish, and the economy may remain fragile in the coming months. 
  • The US dollar may be strong: The market is betting that the interest rate decision announced by the Federal Reserve early Thursday may not raise interest rates, but may maintain hawkish rhetoric. The yield of two-year US bonds, which are more sensitive to monetary policy, rose to 5.08% 

EUR/USD Technical Analysis 


EUR/USD Daily Chart Insights

EUR/USD Daily Chart Insights By Ultima Markets MT4
  • Stochastic Oscillator: The indicator’s fast line and slow line were entangled yesterday, and the market entered a oscillating rhythm again. Wait for the indicator to show long or short signals. 
  • Price Action: After the exchange rate returns to the moving average, a pin bar appears, indicating that short sellers have the upper hand, but short sellers still need to wait for the market to fall below the previous low price of 1.0520. 
  • Flag-shaped consolidation structure: The exchange rate has fluctuated upward since October 4, and the overall price has shown a flag-shaped shock range. The 65 moving average successfully suppressed the further rebound of the exchange rate. Next, we will pay attention to whether today’s market can fall below the range. If the range is still effectively supported, the market will rebound and rise again. Otherwise, short opportunities will come. 

EUR/USD 1-hour Chart Analysis

EUR/USD 1-hour Chart Analysis By Ultima Markets MT4
  • Stochastic Oscillator: The fast line is about to cross the slow line, suggesting that the exchange rate is about to fall into consolidation in the short term. 
  • Moving average combination: The exchange rate fell below the 200-period moving average. Currently, the 33-period moving average and the 65-period moving average have not yet crossed the 200-period moving average. Theoretically, when the fast line crosses the slow line, the market may return to the short-term moving average group. 

Ultima Markets MT4 Pivot Indicator

Ultima Markets MT4 Pivot Indicator for EUR/USD
  • According to the pivot indicator in Ultima Markets MT4, the central price of the day is established at 1.06023, 
  • Bullish Scenario: Bullish sentiment prevails above 1.06023, first target 1.06469, second target 1.07193; 
  • Bearish Outlook: In a bearish scenario below 1.06023, first target 1.05299, second target 1.04851. 

Conclusion 


Canada Inflation Controlled, BOC Keeps Interest Rates on Hold 

BOC Keeps Policy Rates Steady at 5% 

The Bank of Canada (BOC) leaves the overnight rate unchanged at 5% in its October meeting.  

The Bank continues quantitative tightening policies and expects slow growth paces to extend through 2023. However, it foresees a pickup by late 2024 and a more robust growth in 2025. In the latest projection, the BOC forecasts the Canadian economy to grow by 1.2% this year, 0.9% next year, and a more robust 2.5% in 2025. 

(Policy interest rate,BOC) 

Canada Inflation Levels Getting Under Control 

Canada’s CPI readings have been volatile in recent months: 2.8% in June, 4.0% in August, and 3.8% in September. In BOC’s latest projection, CPI is projected to average around 3.5% until the middle of next year. After that, it is expected to gradually decrease and reach 2% by 2025. However, in the near term, inflation is expected to be higher due to the impact of energy prices and the ongoing persistence of core inflation. 

Disclaimer  

Comments, news, research, analysis, price, and all information contained in the article only serve as general information for readers and do not suggest any advice. Ultima Markets has taken reasonable measures to provide up-to-date information, but cannot guarantee accuracy, and may modify without notice. Ultima Markets will not be responsible for any loss incurred due to the application of the information provided. 

Focus on EURUSD today – 26th October 2023 

In this comprehensive analysis, Ultima Markets brings you an insightful breakdown of the EURUSD for 26th October 2023. 

Key Takeaways 

  • ECB will not raise interest rates: Today the European Central Bank announced its latest interest rate decision. In September, the ECB unexpectedly raised interest rates for the tenth consecutive time. But then it was hinted that this round of interest rate hikes is coming to an end and the ECB may not raise interest rates for the rest of this year. The market will focus on whether the ECB has additional forward guidance. 
  • Euro depends on USD: Since the European Central Bank will “almost certainly” keep interest rates unchanged, the euro is more likely to be driven by the economy of the US. Tonight, the United States will announce the number of initial jobless claims last week and PCE data for the third quarter. 

Technical Analysis 

Daily Chart Insights 

  • Stochastic Oscillator: The fast line of the indicator crossed below the slow line yesterday, suggesting that a bearish trend in the market is coming. 
  • Price action: The exchange rate showed a bearish price action on Tuesday, and then the candle bar pulled back to the 5-day moving average and fell below Tuesday’s low, suggesting that bears have the upper hand. 
  • Flag-shaped consolidation structure: The exchange rate has fluctuated upward since October 4, and the overall price has shown a flag-shaped range. Next, we will pay attention to whether price can fall below the range today. If the range is still effectively supported, the market will rebound and rise again. Otherwise, short opportunities will come. 

1-hour Chart Analysis 

  • Stochastic Oscillator: The fast line is about to cross the slow line, suggesting that the exchange rate is about to fall into consolidation in the short term. 
  • Moving average group: The exchange rate fell below the 200-period moving average. Currently, the 33-period moving average and the 65-period moving average have not yet crossed the 200-period moving average. Theoretically, when the fast line crosses the slow line, the market price may pull back to the short-term moving average group. 

Pivot Indicator 

  • According to the pivot indicator in Ultima Markets MT4, the central price of the day is established at 1.05797, 
  • Bullish Scenario: Bullish sentiment prevails above 1.05797, first target 1.05933, second target 1.06205; 
  • Bearish Outlook: In a bearish scenario below  1.05797, first target 1.05526, second target 1.05383. 

Conclusion 

To navigate the complex world of trading successfully, it’s imperative to stay informed and make data-driven decisions. Ultima Markets remains dedicated to providing you with valuable insights to empower your financial journey. 

For personalized guidance tailored to your specific financial situation, please do not hesitate to contact Ultima Markets. 

Join Ultima Markets today and access a comprehensive trading ecosystem equipped with the tools and knowledge needed to thrive in the financial markets. 

Stay tuned for more updates and analyses from our team of experts at Ultima Markets. 

Legal Documents 

Ultima Markets, a trading name of Ultima Markets Ltd, is authorized and regulated by the Financial Services Commission “FSC” of Mauritius as an Investment Dealer (Full-Service Dealer, excluding Underwriting) (license No. GB 23201593). The registered office address: 2nd Floor, The Catalyst, 40 Silicon Avenue, Ebene Cybercity, 72201, Mauritius. 

Copyright © 2023 Ultima Markets Ltd. All rights reserved. 

Disclaimer   

Comments, news, research, analysis, price, and all information contained in the article only serve as general information for readers and do not suggest any advice. Ultima Markets has taken reasonable measures to provide up-to-date information, but cannot guarantee accuracy, and may modify without notice. Ultima Markets will not be responsible for any loss incurred due to the application of the information provided.  

Ultima Markets – Trading Session Adjustment for EU&UK Daylight Saving (DST)

The trading sessions for EU&UK Daylight Saving (DST) will be updated from 29 October 2023 as per the following schedule:
Date Product Original Trading Sessions (GMT+3) Updated Trading Sessions (GMT+3)
2023/10/29 (Sun.) UKOUSD Mon 01:00-24:00
Tue-Fri 03:00-24:00
Mon 02:00-24:00
Tue-Fri 00:00-01:00; 03:00-24:00
Ger40 Mon-Thu 03:15-24:00
Fri 03:15-23:00
Mon-Fri 03:15-23:00
Ger40ft Mon-Thu 03:15-24:00
Fri 03:15-23:00
Mon-Fri 03:15-23:00
ES35 Mon-Fri 09:00-21:00 Mon-Fri 10:00-21:00
Cocoa Mon-Fri 11:45-20:30 Mon-Fri 12:45-20:30
Coffee Mon-Fri 11:15-20:30 Mon-Fri 12:15-20:30
Sugar Mon-Fri 10:30-20:00 Mon-Fri 11:30-20:00
FGBL Mon-Fri 03:15-23:00 Mon-Fri 03:15-24:00
FGBM Mon-Fri 03:15-23:00 Mon-Fri 03:15-24:00
FGBX Mon-Fri 03:15-23:00 Mon-Fri 03:15-24:00
FGBS Mon-Fri 03:15-23:00 Mon-Fri 03:15-24:00
FLG Mon-Fri 10:00-20:00 Mon-Fri 11:00-21:00
FEI Mon-Fri 03:00-23:00 Mon-Fri 04:00-24:00

Friendly Reminder

  • • The mentioned times are based on DST system time GMT+3.
  • • Liquidity providers might adjust the trading sessions base on market conditions. The up-to-date execution data should be subject to information on MT4.
    If you have any questions or require assistance, please do not hesitate to contact [email protected]
.holiday_date td{padding: 39px 10px 33px;}

Germany’s Manufacturing Unexpectedly Rose, Overall Business and Labor Conditions Fell Behind 

Better-than-expected Manufacturing PMI Recorded for Germany  

In October 2023, the HCOB Flash Germany Manufacturing PMI registered a 5-month high of 40.7, surpassing the previous record of 39.6 in September and exceeding expectations of 40.  

Although manufacturing new orders showed substantial losses, it displayed signs of easing and reached its lowest level since June. At the same time, the rate at which companies were reducing their workforce was the fastest since October 2020. On the pricing front, factory gate charges continued their downward trend for the fifth consecutive month, although the rate of decline slowed compared to previous months. On the flip side, manufacturers continued to face significant drops in the costs of purchasing materials. Lastly, it’s worth noting that manufacturers still held pessimistic expectations for the future. 

(HCOB Flash Germany Manufacturing PMI,S&P Global) 

German Composite PMI Displaying Lukewarm Business Activities  

According to an initial estimate, the HCOB Germany Composite PMI fell to 45.8 in October 2023, lower than September’s 46.4 and below the market’s expected 46.7. This indicates a decline in overall economic activity. The service sector, which had shown a slight improvement the previous month, returned to contraction, while manufacturing output continued to decrease. The inflow of new business experienced the sharpest decline since May 2020, and backlogs of work decreased again. 

In addition, there was a rise in unemployment compared to September when workforce numbers had declined for the first time in nearly 3 years. In terms of prices, the rate of inflation for output charges remained relatively stable in October, following a low point in September. Finally, businesses maintained a low level of confidence in the outlook for the year ahead.  

(HCOB Flash Germany Composite PMI Output Index,S&P Global) 

Disclaimer  

Comments, news, research, analysis, price, and all information contained in the article only serve as general information for readers and do not suggest any advice. Ultima Markets has taken reasonable measures to provide up-to-date information, but cannot guarantee accuracy, and may modify without notice. Ultima Markets will not be responsible for any loss incurred due to the application of the information provided. 

Focus on USDCAD today – 25th October 2023 

In this comprehensive analysis, Ultima Markets brings you an insightful breakdown of the USDCAD for 25th October 2023. 

Key Takeaways 

  • BOC is to maintain interest rate : The weak Canadian retail sales data suggests that Canada’s tightening monetary policy has shown results. The Bank of Canada will most likely keep overnight interest rates unchanged at 5.00% tonight. 
  • BOC even has pressure to cut interest rates: Canada’s GDP in the third quarter grew at an annual rate of only 0.2%, far lower than the 1.5% growth predicted by the Bank of Canada. The Bank of Canada will cut interest rates to ease the economic downturn in the future. The market expects the overnight rate to drop to 4.75% or lower by the end of the second quarter of 2024. 
  • Pay attention to the forward guidance: The Bank of Canada’s interest rate path for the year has basically been clear. Focus on the Bank of Canada’s forecast of the economy and interest rate levels in 2024. If it shows a hawkish attitude, be wary of the appreciation trend of the Canadian dollar tonight.  
  • Oil prices drive the depreciation of the Canadian dollar: The price of crude oil fell rapidly after risk aversion gradually subsided, and the Canadian dollar was under pressure to depreciate. If oil prices continue to decline, the USD/CAD may continue to rise.     

Technical Analysis 

Daily Chart Insights 

  • Stochastic Oscillator: Although the fast line once again exceeded the slow line yesterday, the indicator has been relatively volatile since mid-October. The current upward trend is more like an adjustment trend, and it needs to wait for the exchange rate to break through the key price level to be confirmed. 
  • Price Action: The three consecutive candle bars starting on October 5 are a clear downward trend. Therefore, even if the market is rising in the short term, as long as it does not break through the high point of the pin bar on October 5, it cannot be considered as the arrival of bulls. 

4-hour Chart Analysis 

  • Wolfe wave pattern: The upward trend since October 10 has been relatively volatile, and the market trend currently forms a typical Wolfe wave pattern. Wait for point 5 to touch the upper extension line, then the market price will most likely form a short trend. 
  • Elliot Wave Theory: The rapid decline since October 5 is a downward driving wave with a 5-wave structure. The rise since October 10 is temporarily determined to be a corrective wave. Only when the market price breaks through 1.37851, can it be confirmed that the downward driving wave is incorrect. 
  • Fibonacci retracement: The market price broke through the 78.6% retracement of the downward trend, and there was a pullback during the US trading session yesterday. There is a certain probability that the exchange rate will rise. If a clear bearish candlestick pattern appears, the market may move lower quickly.

Pivot Indicator 

  • According to the pivot indicator in Ultima Markets MT4, the central price of the day is established at 1.37193, 
  • Bullish Scenario: Bullish sentiment prevails above 1.37193, first target 1.37765, second target 1.38129; 
  • Bearish Outlook: In a bearish scenario below  1.37193, first target 1.36833, second target 1.36255. 

Conclusion 

To navigate the complex world of trading successfully, it’s imperative to stay informed and make data-driven decisions. Ultima Markets remains dedicated to providing you with valuable insights to empower your financial journey. 

For personalized guidance tailored to your specific financial situation, please do not hesitate to contact Ultima Markets. 

Join Ultima Markets today and access a comprehensive trading ecosystem equipped with the tools and knowledge needed to thrive in the financial markets. 

Stay tuned for more updates and analyses from our team of experts at Ultima Markets. 

Legal Documents 

Ultima Markets, a trading name of Ultima Markets Ltd, is authorized and regulated by the Financial Services Commission “FSC” of Mauritius as an Investment Dealer (Full-Service Dealer, excluding Underwriting) (license No. GB 23201593). The registered office address: 2nd Floor, The Catalyst, 40 Silicon Avenue, Ebene Cybercity, 72201, Mauritius. 

Copyright © 2023 Ultima Markets Ltd. All rights reserved. 

Disclaimer   

Comments, news, research, analysis, price, and all information contained in the article only serve as general information for readers and do not suggest any advice. Ultima Markets has taken reasonable measures to provide up-to-date information, but cannot guarantee accuracy, and may modify without notice. Ultima Markets will not be responsible for any loss incurred due to the application of the information provided.

Employment Stays Viable as Australia’s Manufacturing Sector Remains Sluggish  

Manufacturing PMI Hit Lowest Level in Six Months 

The Judo Bank Flash Australia Manufacturing PMI experienced a decline to 48 during the month of October 2023, down from 48.7 in the preceding month, according to preliminary data. This marks the eighth consecutive monthly decline in business conditions and represents the lowest reading in 6 months, primarily attributed to decreased production and diminished new order volumes in response to weakened demand. Input expenses witnessed a notable surge, driven by mounting inflationary pressures reaching a peak not seen in 7 months. Escalating fuel expenses emerged as one of the principal factors contributing to the upward pricing pressure. Although output charges also rose, the pace of increase was comparatively slower. Given the deteriorating market conditions, business sentiment declined to its lowest level in three and a half years. Encouragingly, employment levels sustained growth, thereby extending the ongoing streak of job creation for a duration of 3 years. 

(Judo Bank Australia Manufacturing PMI,S&P Global) 

Composite PMI in Contractionary Shadow 

The Judo Bank Flash Australia Composite PMI dropped to 47.3 during October 2023, plunging from 51.5 in the preceding month, as per preliminary findings. This figure represents the lowest reading observed over a span of 21 months, driven by a substantial decline in operational performance across Australia’s private sector. The downturn in business activity stemmed from a reduction in incoming orders, an unfavorable demand climate, mounting inflationary pressures, and elevated interest rates. The volume of new export business experienced a decline for the eighth consecutive month. Input costs continued their rapid advancement, stimulated by rising inflation that reached a 3-month high. Output prices exhibited an increase as well, albeit weakened customer demand exerted pressure on pricing capabilities, resulting in the slowest pace of charge inflation since March 2021.  

(The Judo Bank Flash Australia Composite PMI,S&P Global) 


Focus on GBP/USD Today – 24th October 2023 


Comprehensive GBP/USD for October 24, 2023

In this comprehensive analysis, Ultima Markets brings you an insightful breakdown of the GBP/USD for 20th October 2023. 


Key Takeaways 

  • Unemployment rate is the key: The British unemployment rate rose slightly in August, which means that the labor market continues to cool down, reducing inflation to a certain extent. If the unemployment rate continues to rise today, the pound may weaken and fall. 
  • Economic pressure in the UK: UK PMI data for October will be released this afternoon, which has always been below the 50 boom-bust line in the early stage. Last week’s UK retail sales data and inflation report both showed that economic activity is weakening, and today’s data may still be in the contraction range. 

GBP/USD Technical Analysis 

GBP/USD Daily Chart Insights

GBP/USD Daily Chart Insights By Ultima Markets MT4
  • Stochastic Oscillator: The indicator completed the “golden cross” structure again yesterday, and there is a certain probability that the short-term market will continue to rise. 
  • Price Action: Last week the bar came out of a bottom structure. In conjunction with the sharp rise yesterday, the bar has formed an evening star combination structure. The market has a probability of continuing to rise. 
  • Moving average resistance: The current exchange rate is below the 33-day moving average (black line). At the same time, the overall market price and short-term moving average are also below the 200-day moving average (dashed line). Even if it is now experiencing a short-term rise, it cannot be premature to conclude that the reversal of the pound is coming. 

GBP/USD 1-hour Chart Analysis

GBP/USD 1-hour Chart Analysis by Ultima Markets MT4
  • Stochastic oscillator: The indicator is entangled in the overbought area. Currently, bulls in the market have the upper hand, and there is some correction pressure on the short-term exchange rate. 
  • Price action: In the end, the market price broke through the previous lowering highs, the overall downward structure was destroyed, and the intraday market ushered in a reversal. If you want to enter the market with the trend, you need to wait for the retracement structure to appear. 
  • Elliot wave structure: After the market price quickly broke through the upward channel line yesterday, it can be temporarily judged that driving wave 3 is underway. The support position is the upper edge of the upward channel. After the market falls back, you can look for trading opportunities. 

Ultima Markets MT4 Pivot Indicator 

Ultima Markets MT4 Pivot Indicator for GBP/USD
  • According to the pivot indicator in Ultima Markets MT4, the central price of the day is established at 1.22157, 
  • Bullish Scenario: Bullish sentiment prevails above 1.22157, first target 1.22890, second target 1.23315; 
  • Bearish Outlook: In a bearish scenario below  1.22157, first target 1.21739, second target 1.21013. 

Conclusion 


Oil Markets Surge Amidst Geopolitical Uncertainty

Geopolitical Turmoil Fuels Oil Price Surge

Amidst the volatile landscape of the global oil market, October 2023 stands out as a month of upheaval and uncertainty, with crude oil prices surging to a noteworthy $90 per barrel.

This escalation can be attributed to escalating geopolitical tensions, notably the intensifying conflicts between Israel and Gaza, which has far-reaching implications for the world’s energy sector.

Crude Prices Rushed to US$90 on Escalating Tensions in Middle East   

Escalating turmoil between Israel and Gaza ramped up concerns of supply disruptions among key producers in the Middle East. Additionally, U.S. military forces in Iraq were targeted in two separate drone attacks further intensifying market sentiment. Both WIT and Brent have emerged at the $90 per barrel mark, a significant technical threshold.  

Brent Crude One-year Chart By Ultima Markets MT4

(Brent Crude One-year Chart) 

WIT Crude One-year Chart By Ultima Markets MT4

(WIT Crude One-year Chart) 


Sharp Decrease in Global Oil Reserves 

According to the latest International Energy Agency (IEA) report, in August, there was a significant decline in global oil inventories, with a decrease of 63.9 million barrels (mb) observed.

This drop was primarily driven by a massive drawdown of 102.3 mb in crude oil stocks. Initial data indicates that inventories on land continued to decrease in September, but there was a rebound in oil stored on water as exports started to recover.


Inventory Trends

In the OECD countries, industry stocks experienced an unusual decline of 6.5 mb in August, reaching a total of 2,816 mb, which is substantially lower by 105.3 mb compared to the five-year average. 


Conclusion

In conclusion, the surge in crude oil prices to $90 per barrel in October 2023 can be primarily attributed to escalating geopolitical uncertainty, particularly in the Middle East.

The tensions between Israel and Gaza, coupled with drone attacks on U.S. military forces in Iraq, have heightened concerns about potential disruptions in the global oil supply chain.

As a result, the energy industry and financial markets are navigating a period of uncertainty, emphasizing the interconnectedness of geopolitics and global energy markets.

We will continue to watch these developments closely, as they have the potential to reshape the oil market landscape in the coming months.