Important Information

This website is managed by Ultima Markets’ international entities, and it’s important to emphasise that they are not subject to regulation by the FCA in the UK. Therefore, you must understand that you will not have the FCA’s protection when investing through this website – for example:

  • You will not be guaranteed Negative Balance Protection
  • You will not be protected by FCA’s leverage restrictions
  • You will not have the right to settle disputes via the Financial Ombudsman Service (FOS)
  • You will not be protected by Financial Services Compensation Scheme (FSCS)
  • Any monies deposited will not be afforded the protection required under the FCA Client Assets Sourcebook. The level of protection for your funds will be determined by the regulations of the relevant local regulator.

Note: Ultima Markets is currently developing a dedicated website for UK clients and expects to onboard UK clients under FCA regulations in 2026.

If you would like to proceed and visit this website, you acknowledge and confirm the following:

  • 1.The website is owned by Ultima Markets’ international entities and not by Ultima Markets UK Ltd, which is regulated by the FCA.
  • 2.Ultima Markets Limited, or any of the Ultima Markets international entities, are neither based in the UK nor licensed by the FCA.
  • 3.You are accessing the website at your own initiative and have not been solicited by Ultima Markets Limited in any way.
  • 4.Investing through this website does not grant you the protections provided by the FCA.
  • 5.Should you choose to invest through this website or with any of the international Ultima Markets entities, you will be subject to the rules and regulations of the relevant international regulatory authorities, not the FCA.

Ultima Markets wants to make it clear that we are duly licensed and authorised to offer the services and financial derivative products listed on our website. Individuals accessing this website and registering a trading account do so entirely of their own volition and without prior solicitation.

By confirming your decision to proceed with entering the website, you hereby affirm that this decision was solely initiated by you, and no solicitation has been made by any Ultima Markets entity.

I confirm my intention to proceed and enter this website Please direct me to the website operated by Ultima Markets , regulated by the FCA in the United Kingdom

Ultima Markets – Trading Session Adjustment for CHINA50

The trading sessions for CHINA50 will be updated from 18 September 2023 as per the following schedule:
Date Product Original Trading Sessions (GMT+3) Updated Trading Sessions (GMT+3)
2023/9/18 (Mon.) CHINA50 01:00-03:55
04:00-11:55
12:00-24:00
04:00-11:55
12:00-24:00

Friendly Reminder

  • • The mentioned times are based on DST system time GMT+3.
  • • Liquidity providers might adjust the trading sessions base on the dynamic nature of market conditions. The up-to-date execution data should be subject to information on the MetaTrader software/application.
    If you have any questions or require assistance, please do not hesitate to contact [email protected]

Fewer S&P 500 Companies Citing “Inflation” in 2Q23 Conference Calls 

Deciphering the Decline in S&P 500 Companies Citing “Inflation” in 2Q23 Conference Calls

Through Document Search, FactSet searched for the term “inflation” in the conference call transcripts of all the S&P 500 companies that conducted earnings conference calls from June 15 through September 7. 


The Numerical Dip in S&P 500

Of these companies, 296 cited the term “inflation” during their earnings calls for the second quarter. This is the lowest number of S&P 500 companies citing “inflation” on earnings calls going back to Q2 2021 (221). It also marks the fourth consecutive quarter in which the number of S&P 500 companies citing the term “inflation” has declined quarter-over-quarter.

However, it should be noted that the number of S&P 500 companies citing “inflation” on earnings calls for Q2 2023 is still well above the 5-year average of 217 and the 10-year average of 168. 


Sectoral Insights in S&P 500

At the sector level, the Financials (49) and Industrials (46) sectors have the highest number of companies that cited “inflation” on earnings calls for Q2. However, the Consumer Staples (86%), Consumer Discretionary (76%), and Materials (76%) sectors have the highest percentages of companies that cited “inflation” on their Q2 earnings calls during this period. 


Impact on Stock Performance in S&P 500 Companies

It is interesting to note that S&P 500 companies that cited “inflation” on Q2 earnings calls have seen a weaker average stock price performance in recent months compared to S&P 500 companies that did not cite “inflation” on Q2 earnings calls.

For S&P 500 companies that cited “inflation” on Q2 earnings calls, the average change in price since June 30 is -2.8% and the average change in price since December 31 is 2.9%. For S&P 500 companies that did not cite “inflation” on Q2 earnings calls, the average change in price since June 30 is -0.3% and the average change in price since December 31 is 10.4%. 

S&P 500 Survey by FactSet

(Survey by FactSet) 


Conclusion

In conclusion, while the decline in the number of S&P 500 companies referencing “inflation” in their earnings calls is noteworthy, it’s crucial to view these statistics within the broader context.

The relative high numbers compared to historical averages indicate that the topic remains relevant. Additionally, the varying stock performance for companies mentioning “inflation” presents a compelling puzzle for investors and analysts alike.

As the financial landscape continues to evolve, it is imperative to closely monitor these trends to make informed investment decisions.


Disclaimer  

Comments, news, research, analysis, price, and all information contained in the article only serve as general information for readers and do not suggest any advice. Ultima Markets has taken reasonable measures to provide up-to-date information, but cannot guarantee accuracy, and may modify without notice. Ultima Markets will not be responsible for any loss incurred due to the application of the information provided. 

9.12 FX Daily GBP/USD 

Focus on GBP/USD today. 

Fundamentally, UK is to release its latest August unemployment data on Tuesday. The previous PMI final value data for the manufacturing industry confirmed a downward trend, shrinking for the sixth consecutive month. If the job market shows weakness as well, although inflationary pressure decreases, the outlook for the UK economy may be interpreted as sluggish by the market. 

Technically, it can be observed from the weekly chart of the pound that although the random volatility indicator is still in a downward trend, the market is still trapped in the volatility range of the moving average group. 

( Weekly chart of GBP/USD, source: Ultima Markets MT4) 

The 5-week moving average suppressed the rebound in the exchange rate, while the 33-week and 65-week moving averages supported further downward movements in the market. There is still a possibility of further volatility in the market this week. 

(Daily chart of GBP/USD, source: Ultima Markets MT4) 

The short forces on the copper daily chart temporarily have the upper hand. The stochastic oscillator crosses downwards. Since the downward trend since early August has been a downward motive wave, there is a certain probability that the recent decline will continue the extended downward trend. 

(1-hour chart of GBP/USD, source: Ultima Markets MT4) 

On the daily chart, yesterday’s rebound in the market led to a random volatility indicator sending out a bullish signal, but due to yesterday’s K line being only a cross star, the upward momentum of the rebound may be limited. Even if the rebound continues, it is still necessary to conservatively look towards the resistance 1.25675. 

(1-hour chart of GBP/USD, source: Ultima Markets MT4) 

According to the pivot indicator in Ultima Markets MT4, the central price on that day is 1.25065, 

Bullish above 1.25065, with the first target of 1.25511 and the second target of 1.25930 

Bearish below 1.25065, with first target 1.24647 and second target 1.24209 

Disclaimer 

Comments, news, research, analysis, prices and other information contained in this article can only be regarded as general market information, provided only to help readers understand the market situation, and do not constitute investment advice. Ultima Markets will not be responsible for any loss or loss (including but not limited to any loss of profits) that may arise from the direct or indirect use or reliance on such information. 

The Surreal Saga of UK Government’s Skyrocketing Debt

The UK’s Mounting Debt Crisis

UK government debt has soared more than 40% since the Covid-19 outbreak in March 2020, reaching nearly 2.6 trillion pounds ($3.3 trillion), the highest level since the early 2020s and about the same as the country’s annual gross domestic product.


Inflation-Linked Debt: A Troubling Reality

Although some developed countries, for example, the US has debts as a high percentage in its GDP, the UK is unique in this case because 1/4 of its government debt is “index-linked to inflation”.

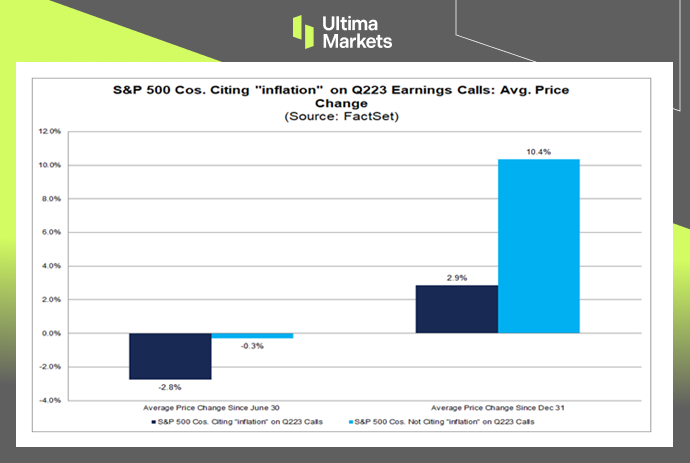
As prices surged in the UK over the past 18 months, so have government repayments of interest on inflation-linked bonds.


The Burden of High Inflation

In the latest fiscal year, high inflation resulted in the highest debt ratio in 40 years, weighing on the country’s finances as it grapples with weak economic growth and an election looming pressure.

The credit ratings company Fitch said, “Britain has a higher debt-repay as a share of government revenue than any other advanced economy.”


The Looming Specter of Credit Downgrade

Britain’s growing debt burden puts it in a precarious position. A downgrade of the country’s credit rating could further raise borrowing costs, although the impact is likely to be limited.

Earlier this month, Fitch canceled the U.S.’s AAA rating, one of the reasons was the increase in the U.S. debt ratio.

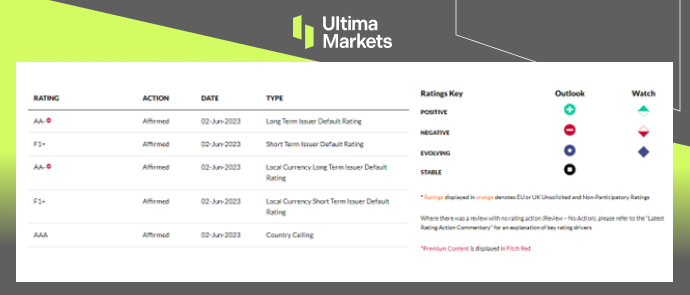
Fitch ‘s current rating outlook on the UK is negative, which means the risk of the country’s rating being downgraded to A from the current AA- rating increases.


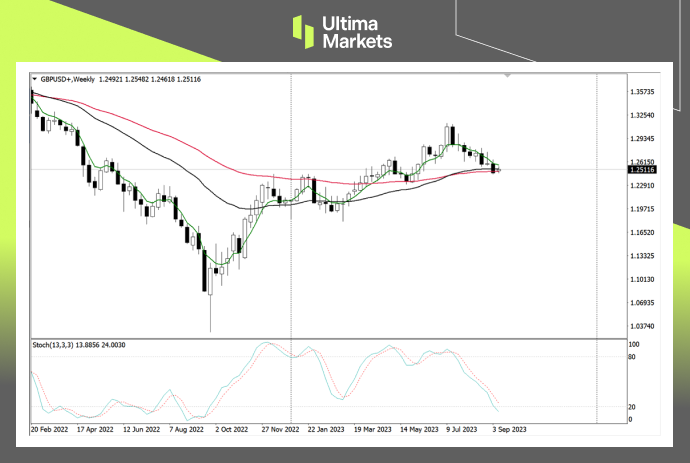
Future Outlook: Waiting for Rating Agencies’ Verdict

The UK’s financial landscape is poised for a significant transformation. Moody’s and S&P are set to release their assessments of the nation’s credit rating on October 20th, with Fitch following suit on December 1st.

These impending evaluations will play a pivotal role in shaping the UK’s financial future.

(UK ratings, Fitch)


Conclusion

In conclusion, the UK’s escalating government debt crisis demands immediate attention. As this hierarchical presentation illustrates, the mounting debt, coupled with inflation-linked complications, has profound implications.

The nation’s credit rating, currently at risk, hinges on the impending assessments by rating agencies. Staying informed and prepared for potential developments in the UK’s financial stability is of utmost importance.


Disclaimer

Comments, news, research, analysis, price, and all information contained in the article only serve as general information for readers and do not suggest any advice. Ultima Markets has taken reasonable measures to provide up-to-date information, but cannot guarantee accuracy, and may modify without notice. Ultima Markets will not be responsible for any loss incurred due to the application of the information provided.

9.8 Metal Daily Copper

Focus on Copper today. 

Fundamentally, after the release of employment data and PMI data, metals are still under pressure due to potential secondary inflation risks in the United States. On the supply side, according to the latest statistics from the London Metal Exchange, copper inventories increased by 3,150 tons. The increase in inventories means that market demand has not expanded. These short-term news still did not lead to a significant decline in copper prices, suggesting that short-term copper still has room for long-term gains after digesting the market news. 

Technically, copper prices are once again close to the 200-week moving average on a weekly basis, and the market showed signs of resistance and rebound in the first two times. 

(Weekly chart of Copper, source: Ultima Markets MT4) 

The 65-week moving average continues to suppress the upper rebound space of copper prices. Pay attention to whether the final closing price of the market today on Friday can effectively break the 200-week moving average. The market deserves to focus on the short trend next week.

(Daily chart of Copper, source: Ultima Markets MT4) 

The short forces on the copper daily cycle temporarily have the upper hand. The stochastic oscillator crosses downwards. Since the downward trend since early August has been a downward motive wave, there is a certain probability that the recent decline will continue the extended downward trend. 

(1-hour chart of Copper, source: Ultima Markets MT4) 

On the intraday 1-hour period, the stochastic oscillator has not entered the overbought area for the time being, and the market is still likely to be a mess. Even if the Asian market is currently falling, we need to wait for the short signal of the stochastic oscillator indicator to be confirmed, and then wait for the breakthrough of the low before we can focus on intraday short trading opportunities.

(1-hour chart of Copper, source: Ultima Markets MT4) 

According to the pivot indicator in Ultima Markets MT4, the pivot price of the day is 3.7334. 

Bullish above 3.7334, first target 3.7575, second target 3.7862 

Bearish below 3.7334, first target 3.7047, second target 3.6805. 

Disclaimer 

Comments, news, research, analysis, prices and other information contained in this article can only be regarded as general market information, provided only to help readers understand the market situation, and do not constitute investment advice. Ultima Markets will not be responsible for any loss or loss (including but not limited to any loss of profits) that may arise from the direct or indirect use or reliance on such information. 

The UK’s Interest Rate Odyssey: Understanding the Essentials

UK Rate Hikes Reached A Plateau 

Bank of England Governor Andrew Bailey said at a Treasury Select Committee hearing on the 7th that the interest rate hike policy is close to the peak, and BoE’s Monetary Policy Committee will make another decision on September 21.  


The Announcement

Britain’s annual inflation rate of 6.8 percent is higher than Prime Minister Rishi Sunak’s planned target of 5 percent by the end of 2023 and is the highest among G7 nations.

The governor explained that due to the increase in crude prices, the inflation data in August may be slightly higher than expected. At the same time, he believes that inflation will be obvious by the end of this year, especially in autumn.

In addition, he pointed out that the Monetary Policy Committee may finally vote in support of raising interest rates in September. 

(Bank rate record, Bank of England) 


Economic Insights

The Bank of England released a monthly survey on the 8th, showing output prices are expected to increase by 4.9% in the next 12 months. The figure, based on a three-month rolling average, was down 0.5 percentage from July and well below last year’s peak of 6.6% in September.

The outlook for wage growth has also dropped to an average of 5.1%, continuing a downward trend from a high of 6% in late 2022. The survey of recruiters points out a cooling labor market. The findings could slow the central bank’s pace of raising interest rates. 


Conclusion

In conclusion, it’s evident that the United Kingdom is currently facing a challenging economic situation with a persistently high inflation rate and signs of a cooling labor market. The comments made by Bank of England Governor Andrew Bailey and the data from the recent survey have sparked discussions about the future of interest rates and economic stability.

As we move forward, it’s crucial for individuals and businesses to monitor these developments closely, as they have the potential to impact various aspects of the economy. Whether you are a trader, investor, or simply someone interested in economic matters, staying informed is the key to making well-informed decisions in these uncertain times.

Remember that financial markets can be volatile, and it’s advisable to seek professional advice and conduct thorough research before making any significant financial decisions. As we await the upcoming decision by the BoE’s Monetary Policy Committee on September 21, the economic landscape in the UK remains a topic of great interest and importance.


Disclaimer  

Comments, news, research, analysis, price, and all information contained in the article only serve as general information for readers and do not suggest any advice. Ultima Markets has taken reasonable measures to provide up-to-date information, but cannot guarantee accuracy, and may modify without notice. Ultima Markets will not be responsible for any loss incurred due to the application of the information provided. 

August ISM Surprise: A Perspective On Economic Fireworks

August Service ISM Surged, Heating up Concerns Over Inflation 

The Institute for Supply Management released the ISM services index for August, which showed a recovery in business activity. The index unexpectedly rose to 54.5 from market expectations of 52.5, up from 52.7 in July and reaching a six-month peak.

From the analysis of the service industry portfolio, as many as 13 of the 18 industries surveyed by the ISM non-manufacturing industry have increased.

Industries such as catering and accommodation, real estate leasing, construction, retail, transportation and warehousing have shown steady expansion of new order demand and willingness to recruit.

The service industry data was better than expected, driving up treasury yields, meanwhile, putting pressure on stock markets. The three major U.S. stock indexes all ended in decline. 

The ISM Non-Manufacturing Index profile 

The ISM Non-Manufacturing Index is a comprehensive indicator that tracks non-manufacturing activities such as employment trends, prices, new orders and other sub-items.

The index takes 50 as the critical point. If the index is at 50, it means that the economy of this month remains unchanged from the previous month; if the index is above 50 for several consecutive months, it indicates that non-manufacturing activities are expanding and prices are rising, implying that the overall economy is in expanding state.

On the contrary, when the index is below the 50 level, it means that the overall economy is in a state of contraction. 

(Service PMI, Institute for Supply Management ISM) 


Conclusion

The August ISM services index report has introduced a level of unpredictability and excitement to the financial landscape. It’s not just a data report; it’s a narrative, a story with twists and turns that continue to unfold.

To stay updated on this ever-evolving economic drama and gain access to expert analysis, make sure to follow our platform closely. We offer the key to unraveling the complex world of finance and economics, providing you with a structured approach to understanding the latest developments.


Disclaimer  

Comments, news, research, analysis, price, and all information contained in the article only serve as general information for readers and do not suggest any advice. Ultima Markets has taken reasonable measures to provide up-to-date information, but cannot guarantee accuracy, and may modify without notice. Ultima Markets will not be responsible for any loss incurred due to the application of the information provided. 

9.7 Metal Daily XAU/USD 

Focus on XAU/USD today. 

Fundamentally, yesterday the United States released ISM data on the service industry, just like the market outlook shared on Monday. The Fed is currently looking for data support. Consumption is one of the three economic carriages in the United States. The good performance of the ISM service industry PMI will greatly stimulate the bullish trend of the US dollar. The PMI data unexpectedly strengthened in August to 54.5, reflecting sustained strength in consumer demand and the overall economy and strengthening hopes that the United States can avoid recession. It also brings potential signs that inflation will still rise, and the dollar will maintain a certain bullish trend until the data is digested this week. 

Technically, the gold finally fell below the 33-day and 7-day moving average yesterday, and the market’s short trend is relatively clear. 

(Daily chart of XAU/USD, source: Ultima Markets MT4) 

The stochastic oscillator also sent a short signal, and the market on the daily chart has a probability of going back to the moving average lines during the Asian session. 

(4-hour chart of XAU/USD, source: Ultima Markets MT4) 

On the 4-hour chart, after the market peaked and fell below the neckline this week, the moving average lines subsequently made a dead cross which is kind of short signal. It is worth noting that the stochastic oscillator currently indicates that the market is about to bottom out, and there is a certain probability of rebound or consolidation. 

(1-hour chart of XAU/USD, source: Ultima Markets MT4) 

According to the pivot indicator in Ultima Markets MT4, the pivot of the day was 1919.46. 

Bullish above 1919.46, the first target is 1923.54, and the second target is 1933.25 

Bearish below 1919.46, the first target is 1909.75, the second target is 1905.56 

Disclaimer 

Comments, news, research, analysis, prices and other information contained in this article can only be regarded as general market information, provided only to help readers understand the market situation, and do not constitute investment advice. Ultima Markets will not be responsible for any damage or loss (including but not limited to any loss of profits) that may arise from the direct or indirect use or reliance on such information. 

Ultima Markets Notification of Server Upgrade

As part of our commitment to providing our clients with the best reliability and service, there will be server upgrade & maintenance this weekend. Trading sessions this weekend are as follows:

Date

Trading sessions (GMT+3)

Trade status

2023/9/2 (Sat.)

08:00-23:59

08:00 Late Open

2023/9/3 (Sun.)

00:00-23:59

Normal

Friendly Reminder

• The features of MetaTrader software & application, including but not limited to logging in, quoting and opening/closing positions, will be temporarily unavailable.

• There might be a gap between the original price and the price after maintenance. The gaps between Pending Orders, Stop Loss and Take Profit will be filled at the market price once the maintenance is completed.

• Please refer to MT4 for the latest update on the completion and market opening time.

• Any client portal functions that contain account data adjustments might be temporarily unavailable.

If you have any questions or require assistance, please do not hesitate to contact [email protected].

Ultima Markets – The Rollover Schedule of Futures in Sep

Futures contracts switch to new contracts on the expiration date regularly, the process is known as “Rollover.” Market prices may experience fluctuations caused by non-market factors after the rollover. Positions in futures contracts will undergo corresponding funding adjustments based on the rollover direction to reflect the value change when transitioning between old and new contracts. Below is the schedule for the futures contract rollover at Ultima Markets in September.

The Rollover Schedule of Futures in Sep

Symbol

Description

Rollover Date

Current Contract

Next Contract

FGBX

Euro – BUXL Futures

2023/9/1

Sep-2023

Dec-2023

FGBS

Euro – Schatz Futures

2023/9/1

Sep-2023

Dec-2023

FGBM

Euro – BOBL Futures

2023/9/5

Sep-2023

Dec-2023

FGBL

Euro – Bund Futures

2023/9/5

Sep-2023

Dec-2023

JPN225ft

Japan 225 Index Future

2023/9/6

Sep-2023

Dec-2023

NAS100ft

NAS100 Future

2023/9/12

Sep-2023

Dec-2023

FRA40ft

France 40 Index Future

2023/9/12

Sep-2023

Oct-2023

UK100ft

UK100 Index Future

2023/9/13

Sep-2023

Dec-2023

FEI

EURIBOR Futures

2023/9/13

Sep-2023

Dec-2023

SP500ft

SP500 Future

2023/9/13

Sep-2023

Dec-2023

DJ30ft

DJ30 Future

2023/9/14

Sep-2023

Dec-2023

GER40ft

Germany 40 Future

2023/9/14

Sep-2023

Dec-2023

CL-OIL

Crude Oil West Texas Future

2023/9/15

Oct-2023

Nov-2023

USDX

US dollar index

2023/9/15

Sep-2023

Dec-2023

VIX

Volatility

2023/9/19

Sep-2023

Oct-2023

UKOUSDft

Brent Oil Future

2023/9/22

Nov-2023

Dec-2023

CHINA50ft

CHINA50 Future

2023/9/26

Sep-2023

Oct-2023

HK50ft

Hong Kong 50 Future

2023/9/27

Sep-2023

Oct-2023

Friendly Reminder

• Internal transfers will be suspended during the half-hour before and after the rollover.

• Investors are advised to carefully manage their positions or adjust the take-profit and stop-loss settings before the rollover.

• Liquidity providers might adjust the rollover schedules base on the dynamic nature of market conditions. The up-to-date execution data should be subject to information on the MetaTrader software/application.

If you have any questions or require assistance, please do not hesitate to contact [email protected].