Comprehensive XAU/USD Analysis for October 13, 2023
In this comprehensive analysis, Ultima Markets brings you an insightful breakdown of the XAU/USD for 17th October 2023.
Key Takeaways
- Market sentiment: The Palestinian-Israeli conflict is still ongoing, and the conflict may continue for a long time. As a result, short-term market risk appetite recovered, and gold prices fell slightly.
- The probability of the Federal Reserve raising interest rates is reduced: Federal Reserve Board member Harker continues to be dovish, reiterating that the Federal Reserve should not consider further raising interest rates and that inflation is expected to weaken. The probability of not raising interest rates in November is over 90%, and the probability of raising interest rates in December is only 30%.
XAU/USD Technical Analysis
XAU/USD Weekly Chart Insights
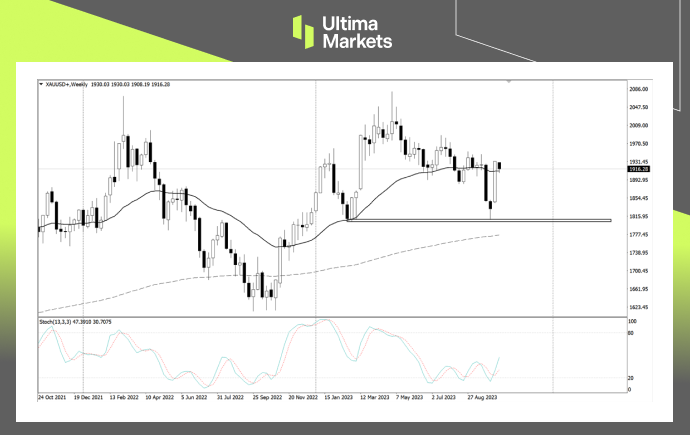
- Price action: The bar showed a bullish price action, but it still needs to wait for this week to break through last week’s high.
- Stochastic Oscillator: The fast line has crossed the slow line, suggesting that the bulls are currently dominant. When entering the market, you need to wait patiently for the price to break through last week’s high.
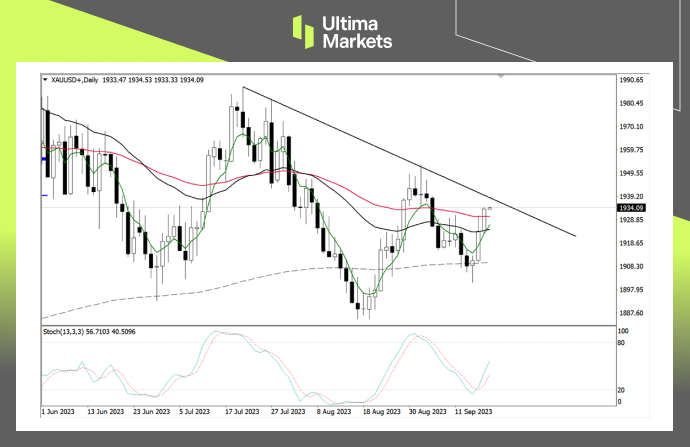
XAU/USD Daily Chart Analysis
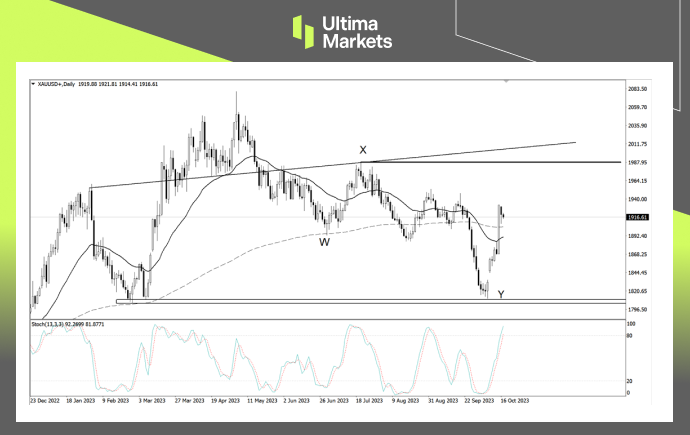
- Elliot Wave: The rapid rise since last Friday is temporarily regarded as motive wave 1, and the internal wave structure is obviously incomplete. This means that the market will continue its upward trend after short-term adjustments. The target looks towards the end point of the double zigzag wave X, which is the key price level.
- Joint resistance area: In addition to the double-zigzag wave, the early neckline extension will also be near the price. It needs to wait for the market to completely break through this resistance range. At that time, short-term long positions may be closed and exited near this price.
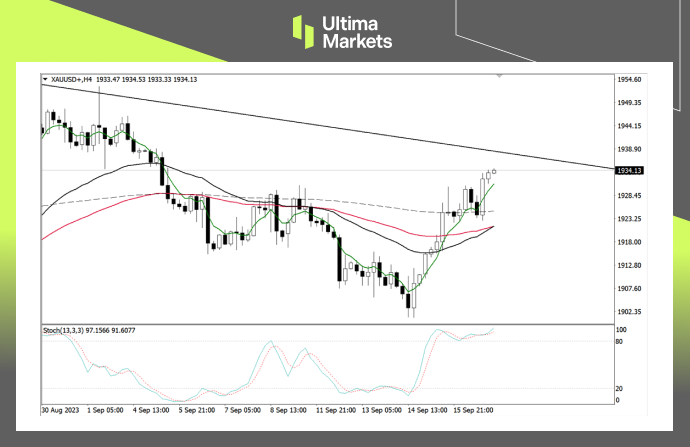
- Stochastic oscillator: Technical indicators have just entered the overbought zone, and the market’s bull momentum is still very strong. You need to switch to a smaller period chart and pay attention to the opportunity to enter the market at any time.
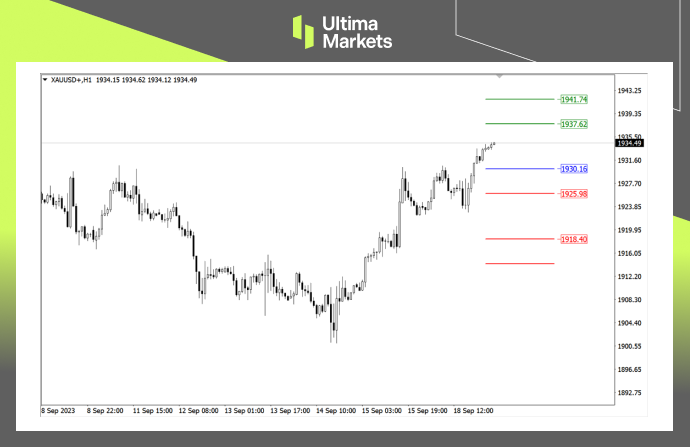
Ultima Markets Pivot Indicator
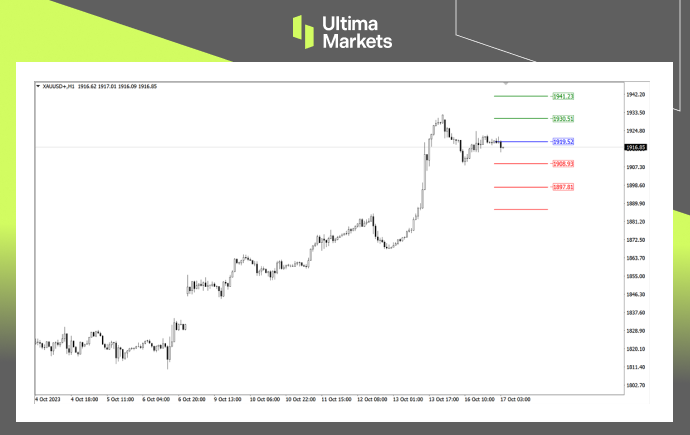
- According to the pivot indicator in Ultima Markets MT4, the central price of the day is established at 1919.52,
- Bullish Scenario: Bullish sentiment prevails above 1919.52, first target 1930.51, second target 1941.23;
- Bearish Outlook: In a bearish scenario below 1919.52, first target 1908.93, second target 1897.81.
Conclusion
Legal Documents
Ultima Markets, a trading name of Ultima Markets Ltd, is authorized and regulated by the Financial Services Commission “FSC” of Mauritius as an Investment Dealer (Full-Service Dealer, excluding Underwriting) (license No. GB 23201593). The registered office address: 2nd Floor, The Catalyst, 40 Silicon Avenue, Ebene Cybercity, 72201, Mauritius.
Disclaimer
Comments, news, research, analysis, price, and all information contained in the article only serve as general information for readers and do not suggest any advice. Ultima Markets has taken reasonable measures to provide up-to-date information, but cannot guarantee accuracy, and may modify without notice. Ultima Markets will not be responsible for any loss incurred due to the application of the information provided.