Comprehensive AUD/USD for November 10, 2023
In this comprehensive analysis, Ultima Markets brings you an insightful breakdown of the AUD/USD for 10th November 2023.
Key Takeaways
- RBA raised interest rates: The Reserve Bank of Australia raised the cash rate by 25 basis points to 4.35% on Tuesday. Since the market had already expected the Reserve Bank of Australia to raise interest rates, the previous appreciation of the Australian dollar had already factored in this information. Subsequently, Bullock hinted that the obstacles to further tightening of policy have increased, causing the Australian dollar to fall.
- The RBA is not strong: In fact, the market is pricing in not only an interest rate hike by the RBA in November, but also another interest rate hike in this cycle. But subsequent RBA statements failed to confirm this hawkish stance, instead taking a data-reliant approach to assessing the need for further tightening.
AUD/USD Technical Analysis
AUD/USD Daily Chart Insights
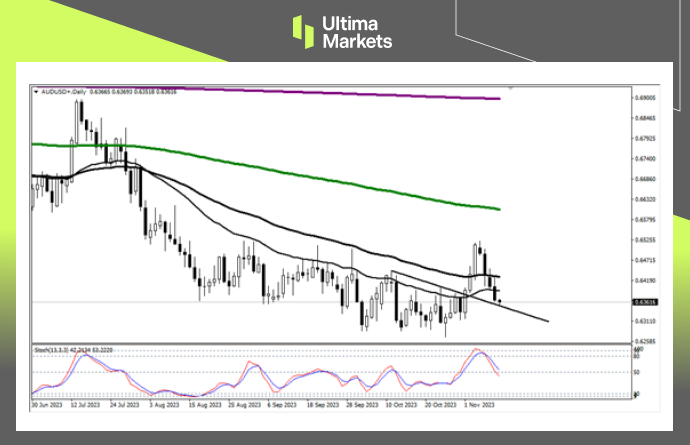
- Stochastic Oscillator: After the indicator issued a short signal, it went all the way down. The short-term trend of the Australian dollar was confirmed to be depreciation. It is worth noting that it is close to the 50 mid-line, so be wary of a rebound or reversal.
- Moving average combination: The exchange rate fell below the moving support formed by the 33-day and 65-day moving average combination. After the exchange rate closed below the 33-day moving average yesterday, the probability of the market continuing to decline increased.
- Downward trend line: On November 1, the exchange rate broke through the downward trend line, and today it stepped back on the trend line. If there is any stop signal, the exchange rate still has the possibility of reversing upward.
AUD/USD 4-hour Chart Analysis
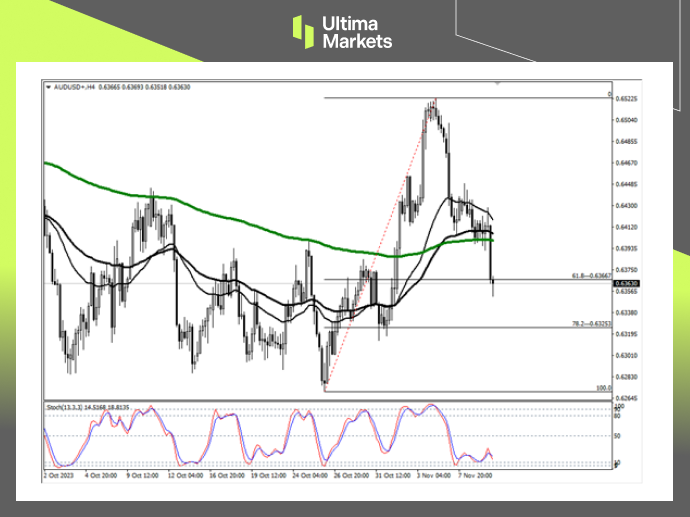
- Stochastic oscillator: The indicator is not currently oversold, and there is a certain bottom divergence pattern in line with the market, suggesting that the current downward space is limited, and may enter an adjustment or even rebound next.
- Fibonacci retracement level: Yesterday, the exchange rate fell rapidly to the 61.8% Fibonacci retracement level. Usually, such a rapid decline close to the resistance area has a certain probability of rebound.
Ultima Markets MT4 Pivot Indicator
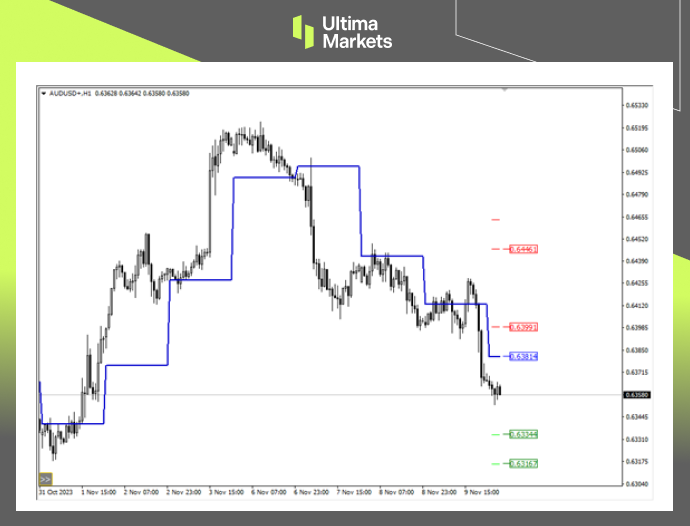
- According to the pivot indicator in Ultima Markets MT4, the central price of the day is established at 0.63814,
- Bullish Scenario: Bullish sentiment prevails above 0.63814, first target 0.63991, second target 0.64461;
- Bearish Outlook: In a bearish scenario below 0.63814, first target 0.63344, second target 0.63167.
Conclusion

Comprehensive AUD/USD for November 7, 2023
In this comprehensive analysis, Ultima Markets brings you an insightful breakdown of the AUD/USD for 7th November 2023.
Key Takeaways
- Changes in the RBA’s monetary policy: The Reserve Bank of Australia will announce its latest interest rate decision at noon. Due to the unexpectedly strong CPI in Australia in the third quarter and the rebound in housing prices to near record highs, the market expects that the possibility of the Reserve Bank of Australia raising interest rates by 25 basis points this week reaches 60% %. On the contrary, if there is no sign of tightening in monetary policy, AUD/USD will enter a rapid downward trend.
- Bullock has a hawkish attitude: The new chairman of the Reserve Bank of Australia, Bullock, said in a public speech that “if the inflation outlook shows a substantial increase, we will not hesitate to further raise the cash rate.” Expectations that the Reserve Bank of Australia will resume raising interest rates have triggered a strong rise in the Australian dollar recently.
AUD/USD Technical Analysis
AUD/USD Daily Chart Insights
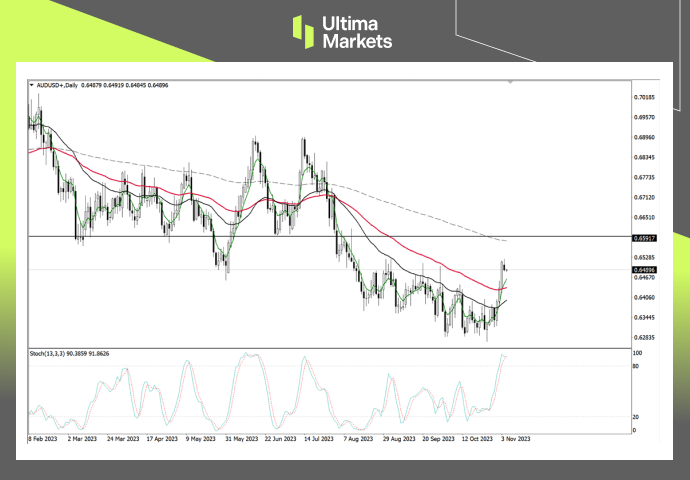
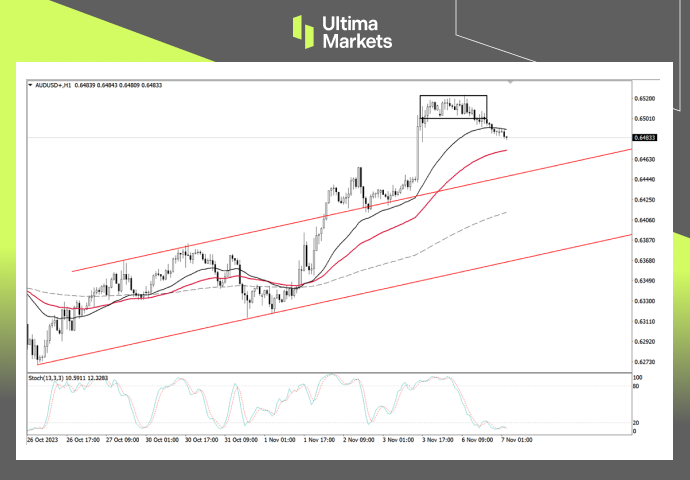
- Stochastic Oscillator: The indicator has entered the overbought area, indicating the strength of the current bullish trend. Although there were signs of a reversal yesterday, we cannot judge that a reversal is coming without confirmation.
- Moving average: After the exchange rate strongly breaks through the 33-day moving average and the 65-day moving average, it hints that the current bullish trend is coming, and the resistance level is looking towards the 200-day moving average (dashed line). There is a certain probability of going back to the green 5-day moving average.
AUD / USD 1-hour Chart Analysis
- Stochastic oscillator: The indicator is still in the oversold area. Judging from the market trend, it is currently in the consolidation stage. Wait for the indicator to show a long signal before paying attention to whether there are trading opportunities.
- Price Action: After consolidation for two trading days, the market formed a rectangular range. After falling below the range, the exchange rate will most likely continue to decline in the short term. Pay attention to the support price below.
- Support price: The red 65-period moving average is the first target support level. If the market enters a deep correction, continue to look at the upper edge of the upward channel line.
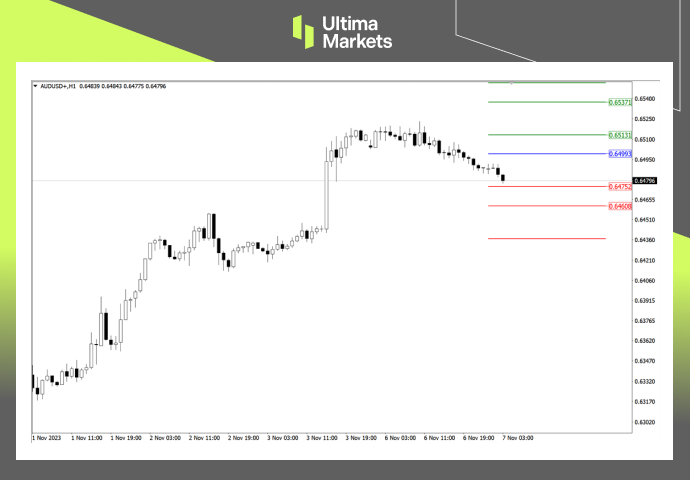
Ultima Markets MT4 Pivot Indicator
- According to the pivot indicator in Ultima Markets MT4, the central price of the day is established at 0.64993,
- Bullish Scenario: Bullish sentiment prevails above 0.64993, first target 0.65131, second target 0.65371;
- Bearish Outlook: In a bearish scenario below 0.64993, first target 0.64752, second target 0.64608.
Conclusion