This website is managed by Ultima Markets’ international entities, and it’s important to emphasise that they are not subject to regulation by the FCA in the UK. Therefore, you must understand that you will not have the FCA’s protection when investing through this website – for example:
You will not be guaranteed Negative Balance Protection
You will not be protected by FCA’s leverage restrictions
You will not have the right to settle disputes via the Financial Ombudsman Service (FOS)
You will not be protected by Financial Services Compensation Scheme (FSCS)
Any monies deposited will not be afforded the protection required under the FCA Client Assets Sourcebook. The level of protection for your funds will be determined by the regulations of the relevant local regulator.
Note: Ultima Markets is currently developing a dedicated website for UK clients and expects to onboard UK clients under FCA regulations in 2026.
If you would like to proceed and visit this website, you acknowledge and confirm the following:
1.The website is owned by Ultima Markets’ international entities and not by Ultima Markets UK Ltd, which is regulated by the FCA.
2.Ultima Markets Limited, or any of the Ultima Markets international entities, are neither based in the UK nor licensed by the FCA.
3.You are accessing the website at your own initiative and have not been solicited by Ultima Markets Limited in any way.
4.Investing through this website does not grant you the protections provided by the FCA.
5.Should you choose to invest through this website or with any of the international Ultima Markets entities, you will be subject to the rules and regulations of the relevant international regulatory authorities, not the FCA.
Ultima Markets wants to make it clear that we are duly licensed and authorised to offer the services and financial derivative products listed on our website. Individuals accessing this website and registering a trading account do so entirely of their own volition and without prior solicitation.
By confirming your decision to proceed with entering the website, you hereby affirm that this decision was solely initiated by you, and no solicitation has been made by any Ultima Markets entity.
In the fast-paced world of integrated circuit (IC) design, the tides are constantly shifting, and the recent performance of the industry’s top players has been nothing short of remarkable.
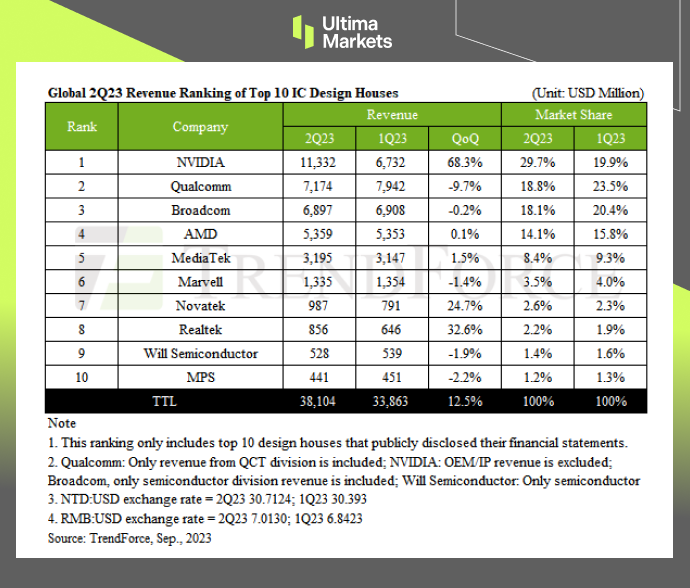
According to TrendForce reports, fueled by an AI-driven inventory stocking frenzy across the supply chain, 2Q23 revenue for the top 10 global IC design powerhouses soared to US $38.1 billion, marking a 12.5% quarterly increase.
In this rising tide, NVIDIA seized the crown, officially dethroning Qualcomm as the world’s premier IC design house, while the remainder of the leaderboard remained stable.
(2Q23 World’s top 10 IC design houses, TrendForce)
NVIDIA: The New Kingpin
NVIDIA benefited from global CSPs (cloud service providers), internet company and enterprise generative AI, large-scale language model import application demands, and its data center revenue increased by as much as 105% quarterly.
In addition, revenue from gaming and professional visualization businesses also continued to grow, driven by new products.
Overall, revenue in the second quarter reached US$11.33 billion, a quarterly increase of 68.3%.
Qualcomm’s Challenges
Qualcomm’s Q2 took a hit as the Android smartphone sector grappled with dwindling demand and Apple’s modem pre-purchases resulted in a subdued seasonal rhythm.
Consequently, their revenue slid by 9.7%, rounding off at about US$7.17 billion.
Broadcom’s Mixed Bag
Broadcom benefited from the sales of high-end switches and routers catalyzed by generative AI, its NetCom business increased by about 9% quarterly.
However, offset by the decline in server storage, broadband, and wireless business, the second quarter revenue was roughly the same as the previous quarter at about $6.9 billion.
AMD’s Steady Stance
AMD’s overall second-quarter revenue was roughly the same as the previous quarter at about US$5.36 billion, due to the decline in gaming GPU sales and embedded business in the second quarter.
The Outlook for IC Design Houses
Although the inventory levels of semi-companies have improved significantly compared with those in 1H23, the outlook for the second half of the year tends to be conservative because of the weak market demand.
It is worth noting that the wave of generative AI and large-scale language model deployment has emerged among Internet companies and private enterprises.
It is expected that AI will be more helpful to related supply chain operations in the second half of the year, and the average sales unit price of such products will be higher than that of consumer products.
As a result, the world’s top ten IC design revenue will continue to have double-digit quarterly growth in the third quarter, and the output value is expected to reach a new high.
Disclaimer
Comments, news, research, analysis, price, and all information contained in the article only serve as general information for readers and do not suggest any advice. Ultima Markets has taken reasonable measures to provide up-to-date information, but cannot guarantee accuracy, and may modify without notice. Ultima Markets will not be responsible for any loss incurred due to the application of the information provided.
Written on September 28, 2023 at 11:56 am, by mervin
Comments Off on Top 10 IC Design Houses Recorded Revenue Up 12.5% QOQ, And Growth Is Expected To Extend In 3Q23
Comprehensive AUD/USD Analysis for September 28, 2023
In this comprehensive analysis, Ultima Markets brings you an insightful breakdown of AUD/USD for 28th September 2023.
Key Takeaways
Australian Inflation: Australian inflation reached a notable 5.2% in September 2023, in line with market expectations. This marked a significant uptick since June and is primarily attributed to the depreciation of the Australian dollar and rising oil prices.
Market Perception: The market’s consensus was that these inflationary pressures, while substantial, would not be adequate to persuade the RBA to pursue an interest rate hike strategy. As a result, the initial reaction in the currency markets was mixed. The Australian dollar experienced a short-lived appreciation, but the prevailing sentiment soon led to a decline.
Short-Term vs. Long-Term Impact
Short-Term Outlook: The short-term Australian data had a limited impact on the currency pair. Market attention swiftly shifted to the United States, with a specific focus on the core PCE data. Should this data continue to show an upward trend, it could maintain the possibility of interest rate hikes during the year, consequently bolstering the US dollar.
Budgetary Concerns: However, the situation in the United States presents a significant variable. The fiscal year for 2023 is concluding, and if political parties fail to reach an agreement on the budget, the risk of a government shutdown looms large. In such an event, the market may seize the opportunity to speculate on a weakening US dollar.
Technical Analysis
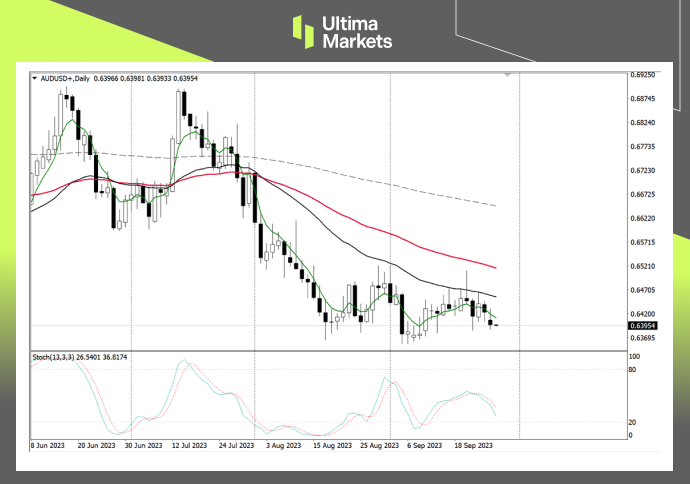
AUD/USD Daily Chart Analysis
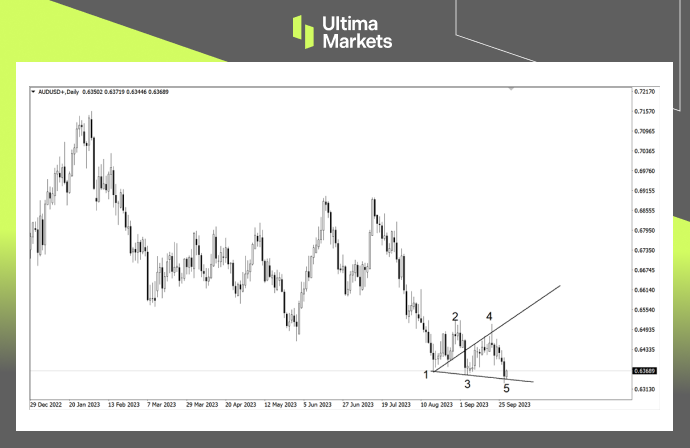
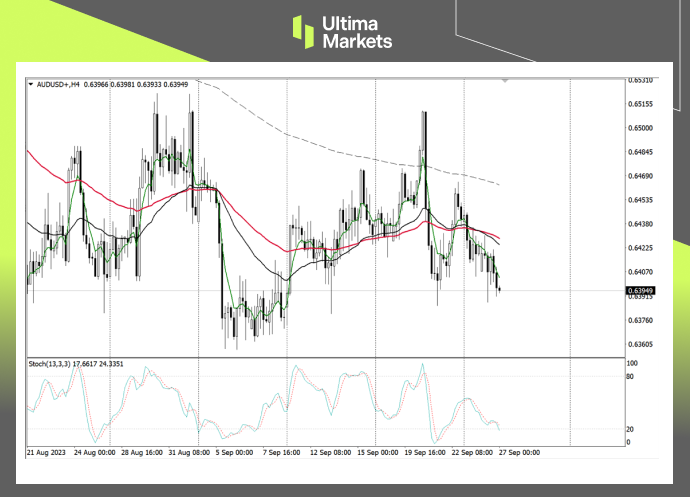
(Daily chart of AUD/USD, source: Ultima Markets MT4)
Significant Decline: The daily chart indicated an expected decline in the exchange rate following the inflation data release. Subsequently, the market exhibited a distinctive Wolfe wave pattern, which carries the potential for a substantial rebound. It’s important to note that this pattern does not signify a definitive trend reversal at this stage.
AUD/USD 4-Hour Chart Analysis
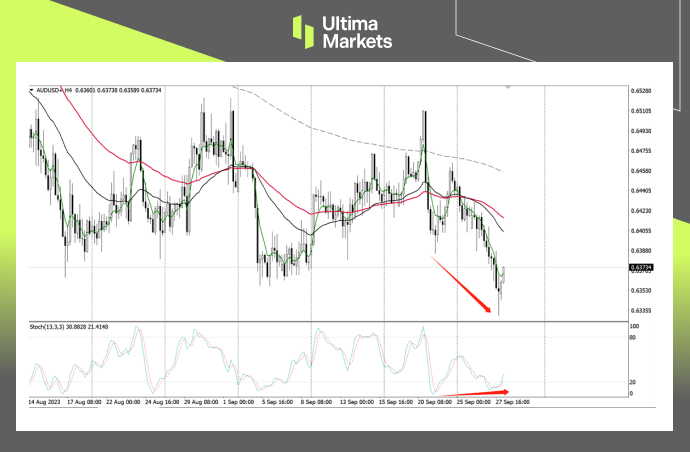
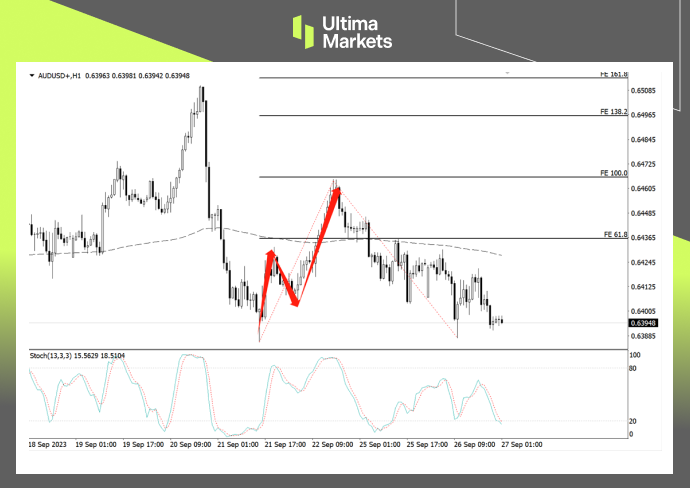
(4-hour chart of AUD/USD, source: Ultima Markets MT4)
Divergence Structure: Transitioning to the 4-hour chart, the price decline led to the formation of a stochastic divergence pattern. This suggests that sellers may find motivation to close their positions and exit at the support level. Observing the influence of the 33-period moving average is crucial.
AUD/USD 1-Hour Chart Analysis
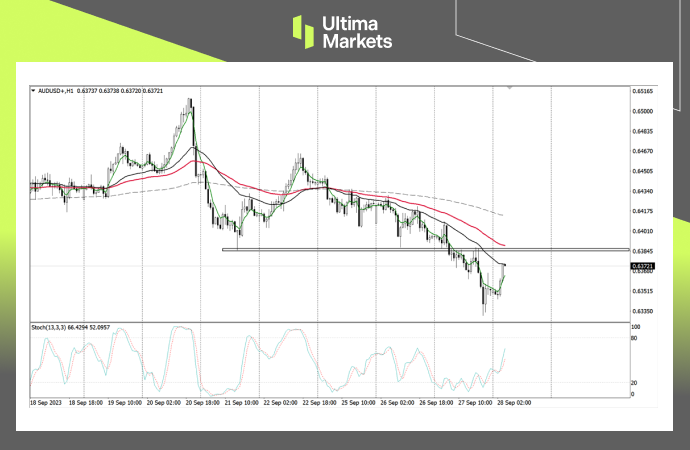
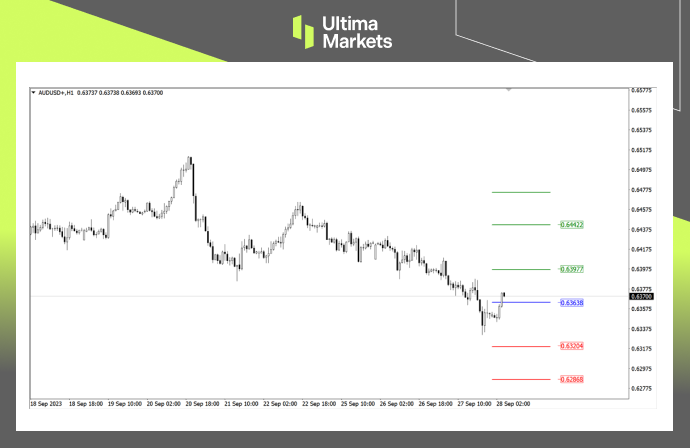
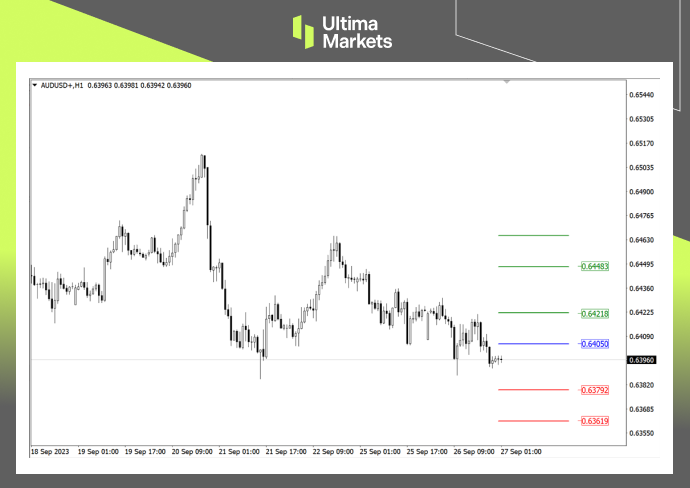
(1-hour chart of AUD/USD, source: Ultima Markets MT4)
Critical Zone: Within the 1-hour timeframe, the area around 0.63853 is a crucial support and resistance conversion zone. This level is also proximate to the 65-period moving average. A potential breakout above this resistance level may pose challenges for the Australian dollar in maintaining its downward trajectory for the day.
Pivot Indicator
(1-hour chart of AUD/USD, source: Ultima Markets MT4)
In bullish scenarios above this level, the first target is 0.63977, and the second target extends to 0.64422.
In bearish scenarios below 0.63638, the first target is 0.63204, with the second target at 0.62868.
Legal Documents
Ultima Markets, a trading name of Ultima Markets Ltd, is authorized and regulated by the Financial Services Commission “FSC” of Mauritius as an Investment Dealer (Full-Service Dealer, excluding Underwriting) (license No. GB 23201593). The registered office address: 2nd Floor, The Catalyst, 40 Silicon Avenue, Ebene Cybercity, 72201, Mauritius.
Disclaimer
Comments, news, research, analysis, price, and all information contained in the article only serve as general information for readers and do not suggest any advice. Ultima Markets has taken reasonable measures to provide up-to-date information, but cannot guarantee accuracy, and may modify without notice. Ultima Markets will not be responsible for any loss incurred due to the application of the information provided.
How Supply Chain Tensions Impact Crude Oil Prices in October 2023
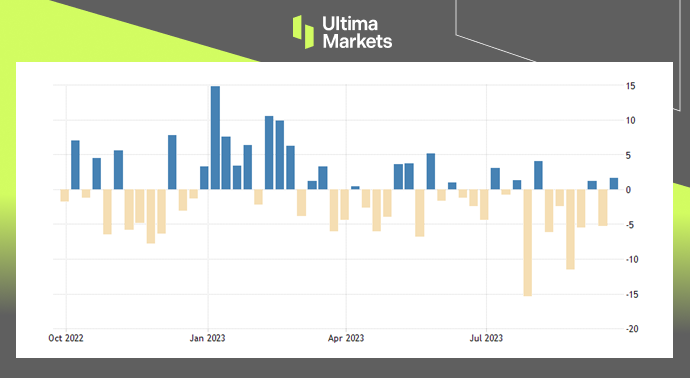
The American Petroleum Institute’s weekly statistical report shows that U.S. crude oil inventories increased by 1.586 million barrels in the week ending September 22, 2023, after a decrease of 5.25 million barrels in the previous week.
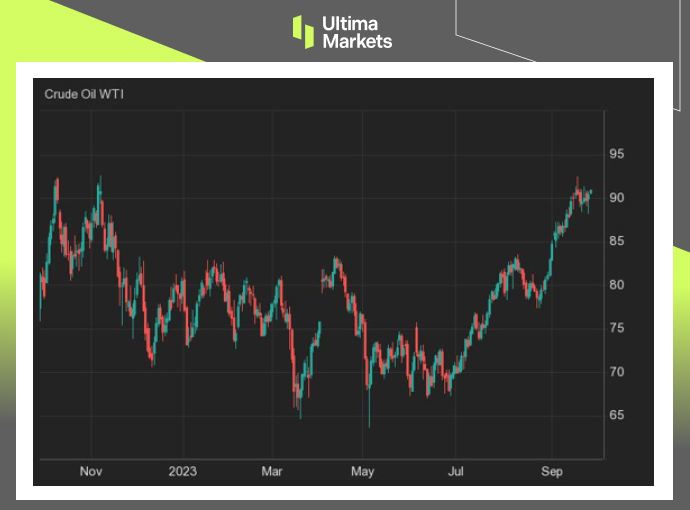
WTI crude futures rebounded to $90.7 a barrel, hovering at their highest level since November. The prospect of tight supplies helped markets shake off worries about rising interest rates and their impact on the economy.
The $90 pivot point is psychologically important and reinforces the belief that the market is poised for further upside.
Additionally, crude oil tends to perform well in inflationary environments as investors seek refuge in tangible assets rather than currencies.
(United States API Crude Oil Stock Change)
(WTI crude Daily chart)
Disclaimer
Comments, news, research, analysis, price, and all information contained in the article only serve as general information for readers and do not suggest any advice. Ultima Markets has taken reasonable measures to provide up-to-date information, but cannot guarantee accuracy, and may modify without notice. Ultima Markets will not be responsible for any loss incurred due to the application of the information provided.
Written on September 27, 2023 at 11:39 am, by mervin
Comments Off on Supply Chain Tensions Causes Crude Prices To Hover Higher
Comprehensive AUD/USD Analysis for September 27, 2023
In this comprehensive analysis, Ultima Markets brings you an insightful breakdown of the AUD/USD for 27th September 2023.
Key Takeaways
Fundamentally, our analysis centers on the forthcoming release of Australia’s August CPI data and its potential repercussions for the AUD/USD market. Key takeaways include:
Inflation Expectations: Market consensus points to a potential inflation rise from 4.9% in July to 5.2% in August, fueling discussions on impending interest rate hikes.
Drivers of Inflation: The depreciation of the Australian dollar and escalating oil prices are identified as the driving forces behind the expected inflation surge.
RBA’s Dilemma: The Reserve Bank of Australia (RBA) faces the pivotal decision of whether to implement interest rate hikes, with market expectations influencing their stance.
Market Reaction: Anticipate a post-data release rebound in the Australian dollar, though the sustainability of this uptrend remains uncertain.
AUD/USD Technical Analysis
AUD/USD Daily Chart Analysis
( Daily chart of AUD/USD, source: Ultima Markets MT4)
On the daily chart, the U.S. dollar index has exhibited a notable upward trajectory. Key technical observations include:
Breakthrough: The U.S. dollar index has closed above the upper boundary of its consolidation range.
Stochastic Oscillator: An upward cross on the stochastic oscillator underscores the bullish trend in the U.S. dollar index.
AUD/USD 4-hour Chart Observations
(4-hour chart of AUD/USD, source: Ultima Markets MT4)
Shifting focus to the 4-hour chart, we identify essential technical aspects that inform market dynamics:
Previous High Breakthrough: Following a 12-day consolidation phase after the U.S. dollar index surpassed its previous high on September 5, it has continued its upward course.
1-hour Chart and ATR Combination Indicator
(1-hour chart of AUD/USD, source: Ultima Markets MT4)
The 1-hour chart and the ATR combination indicator offer granular insights into the market:
Breakthrough Effectiveness: The ATR combination indicator supports the effectiveness of the U.S. dollar index breakthrough.
Potential Retracement: During the Asian session, a retracement is anticipated, necessitating patience from traders. The initial target is set at 105.443.
Pivot Indicator Analysis
(1-hour chart of AUD/USD, source: Ultima Markets MT4)
Airlines Issue Profit Warnings as Cost Pressure Rises
Last week, American Airlines and Spirit Airlines joined other airlines in issuing profit warnings that rising costs would hit profits during the peak summer season, as airlines begin reporting third-quarter results in mid-October.
Consequences for Airlines
American Airlines said it expects adjusted earnings per share in the third quarter to be between 20 cents and 30 cents, down from its previous forecast of 95 cents per share, citing higher fuel prices and new labor deals. The airline cut its operating profit margin in half from its forecast earlier this summer to 4% to 5%.
Spirit Airlines expects negative profit margins of up to 15.5% in the three months ended September 30, down from its previous forecast of -5.5% to -7.5%. The airline also lowered its revenue forecast for the third quarter.
Frontier Airlines said, “In recent weeks, sales have been trending below historical seasonality patterns” and forecasted an adjusted loss for the quarter. The airline’s shares hit a 52-week low.
Outlook for the Industry
Airlines have lost the pricing power they gained last summer as lockdown eased and capacity constrained. Now they face a slow season when travel demand traditionally slows.
Fare tracking company Hopper said: “Fare prices are expected to continue to decline during the fall off-season, with domestic U.S. fares averaging $211 in September and October, down 30% from the summer peak.”
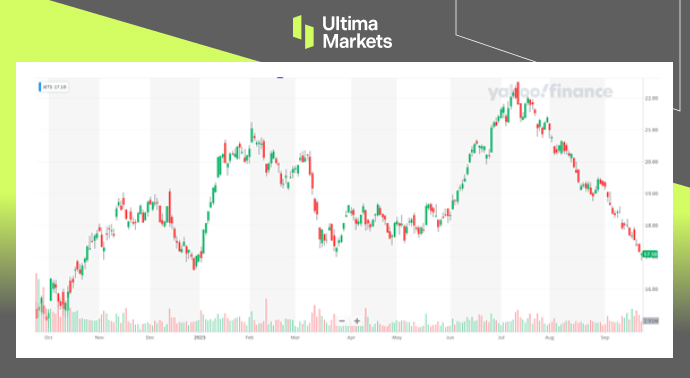
(Global Airlines ETF ticker: JETS, US Global Investors)
Conclusion
The airline industry finds itself at a critical juncture, navigating through a turbulent environment marked by rising costs, shrinking profit margins, and waning pricing power.
The third-quarter results will serve as a litmus test, shedding further light on the industry’s ability to adapt and prosper in the face of these formidable challenges.
As stakeholders watch closely, adaptability and resilience will be key to ensuring a successful flight through these trying times.
Disclaimer
Comments, news, research, analysis, price, and all information contained in the article only serve as general information for readers and do not suggest any advice. Ultima Markets has taken reasonable measures to provide up-to-date information, but cannot guarantee accuracy, and may modify without notice. Ultima Markets will not be responsible for any loss incurred due to the application of the information provided.
Written on September 26, 2023 at 11:41 am, by mervin
Comments Off on Airlines in Turmoil: Profit Warnings and Escalating Costs
While September saw a halt in interest rate hikes, the dot plot projections signal a potential resurgence in rate increases later in the year.
This is underpinned by a forthcoming, more hawkish monetary policy in the next year, with a notable reduction in the number of projected interest rate cuts.
USDX Technical Analysis
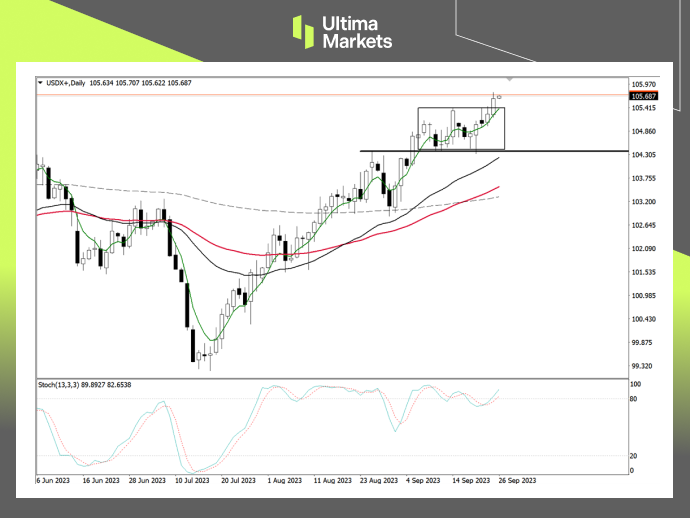
USDX Daily Chart Insights
( Daily chart of USDX, source: Ultima Markets MT4)
Turning our focus to the technical landscape, the USDX exhibits compelling upward momentum.
The daily chart reveals a breakthrough as the US Dollar Index’s price closes above its consolidation range’s upper boundary.
Moreover, the stochastic oscillator, a pivotal technical indicator, has signaled a bullish trajectory.
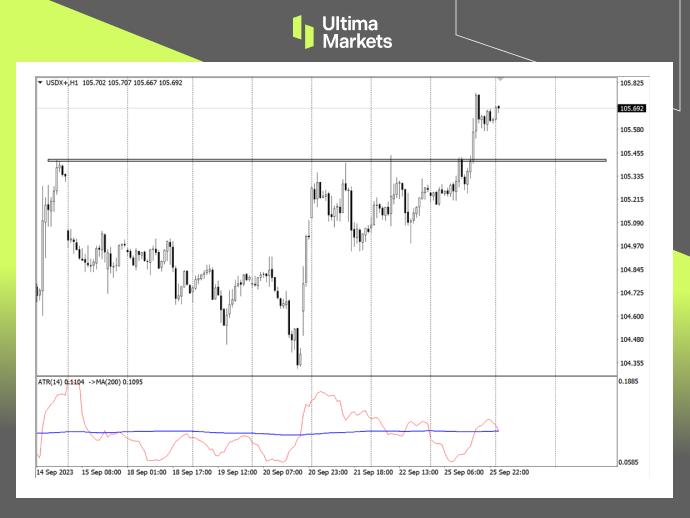
USDX 1-Hour Chart Analysis
(1-hour chart of USDX, source: Ultima Markets MT4)
The one-hour chart presents a more granular picture, with the ATR combination indicator affirming the effectiveness of the recent breakthrough.
Although retracement is conceivable during the Asian trading session, a market rebound is anticipated. The initial target is fixed at the support price of 105.443.
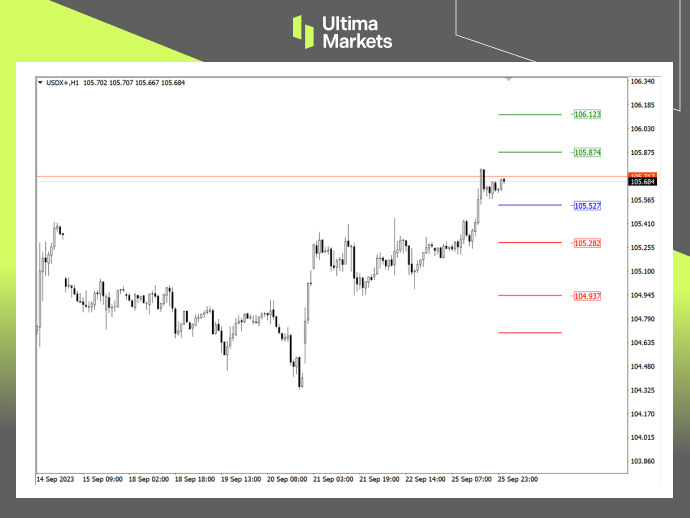
Ultima Markets Pivot Indicator
(1-hour chart of USDX, source: Ultima Markets MT4)
Ultima Market’s MT4 pivot indicator designates the day’s central price at 105.527. For investors and traders, here are the essential projections:
Bullish Scenario:
Bullish above 105.527
First target: 105.874
Second target: 106.123
Bearish Scenario:
Bearish below 105.527
First target: 105.282
Second target: 104.937
These projections, though subject to market dynamics and emerging data, provide a compass for navigating the ever-evolving terrain of financial markets.
Conclusion
Written on September 26, 2023 at 11:30 am, by mervin
Comments Off on Focus on USDX Today – 26th Sep 2023
The Bank of Japan’s Monetary Policy: Prioritizing Stability and Inflation Targets
The Bank of Japan (BoJ) maintained ultra-low interest rates on Sep. 22 and its pledge to keep supporting the economy until inflation sustainably hits its 2% target, suggesting it was in no rush to phase out its massive stimulus program.
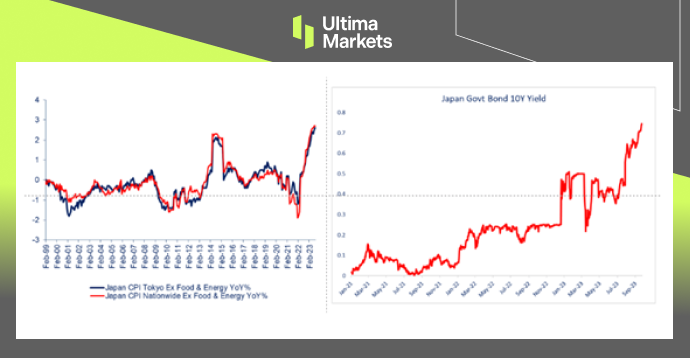
In terms of inflation data for August, Japan’s core CPI, excluding fresh food, came in at 3.1%, above the Bank of Japan’s target of 2% for the 17th month in a row. Another core-core CPI which excludes volatile fuel prices and fresh food, reached 4.3%. Higher import costs boosted the inflation.
Yield Curve Control: A Pillar of Stability
The BOJ’s yield curve control program remains intact, with short-term interest rates at minus 0.1% and 10-year Japanese government bond yields guided around zero percent.
Governor Kazuo Ueda’s recent hint at ending negative interest rates if prices and wages rise added another layer of complexity to the discussion. Ueda suggested that sufficient information and data would be available by year-end to facilitate a decision.
(Japan CPI YoY% & 10Y JGB Yield)
Conclusion
In summary, the Bank of Japan’s decision to maintain ultra-low interest rates, even in the face of rising inflation, exemplifies a resolute commitment to steering the nation’s economy on a stable course.
By prioritizing stability and economic growth, addressing the persistent inflation challenge, and fostering transparency in decision-making, the BoJ assures its continued role in Japan’s economic journey.
Governor Kazuo Ueda’s hint at potential changes in policy adds a layer of anticipation to the financial landscape.
As the situation evolves, market participants and analysts will remain vigilant, as this strategic decision’s impact unfolds.
Disclaimer
Comments, news, research, analysis, price, and all information contained in the article only serve as general information for readers and do not suggest any advice. Ultima Markets has taken reasonable measures to provide up-to-date information, but cannot guarantee accuracy, and may modify without notice. Ultima Markets will not be responsible for any loss incurred due to the application of the information provided.
Written on September 25, 2023 at 11:17 am, by mervin
Comments Off on Bank of Japan: Navigating Economic Challenges with Caution
Comprehensive USD/CNH Analysis for September 22, 2023
In this comprehensive analysis, Ultima Markets brings you an insightful breakdown of the USD/CNH for 22nd September 2023.
Key Takeaways
The Federal Reserve’s Decision: In September, the Federal Reserve made a pivotal decision to halt interest rate hikes. The dot plot hints at the possibility of future rate increases.
Furthermore, the overall monetary policy for the upcoming year leans towards a more hawkish stance, with a shift from an anticipated 5 interest rate cuts to just 2.
These factors collectively maintain the US dollar’s dominance, momentarily placing non-US currencies at a disadvantage.
USD/CNH Technical Analysis
USD/CNH Daily Chart Signals
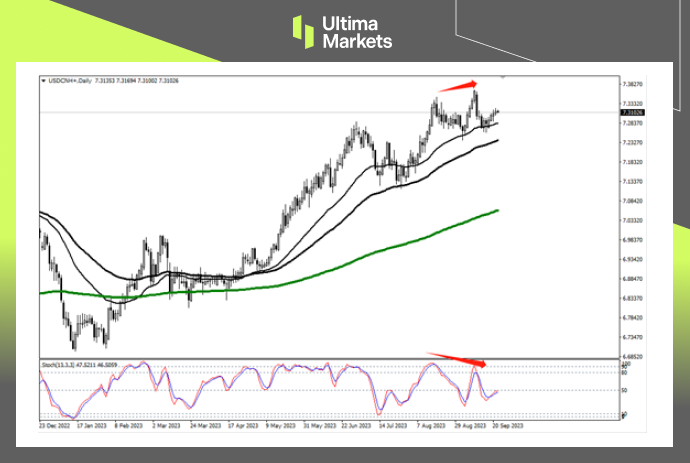
(Daily chart of USD/CNH, source: Ultima Markets MT4)
Rebound and Candle Pattern: Our analysis of the daily chart reveals an interesting rebound in the USD/CNH pair after reaching the 33-day moving average.
This rebound pattern closely resembles a head and shoulders candle formation. This chart development signifies a potential right shoulder formation.
USD/CNH 4-Hour Chart Dynamics
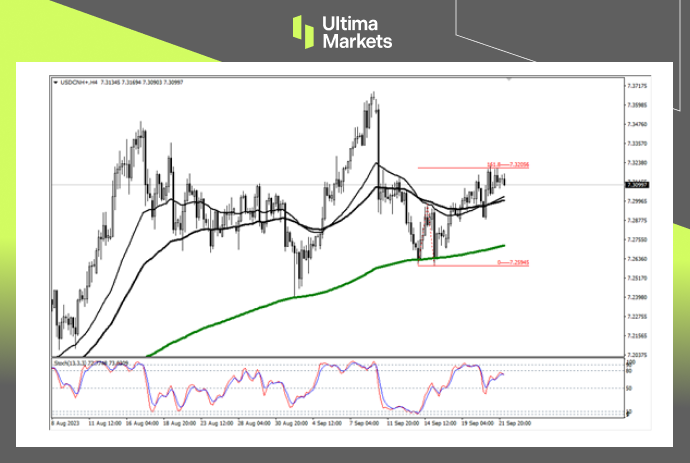
(4-hour chart of USD/CNH, source: Ultima Markets MT4)
Rebound Magnitude: Transitioning to the 4-hour chart, we observe that the recent rebound of USD/CNH has reached a significant level, approximately 1.618 times the rebound height recorded on September 14.
It is vital to keep a close watch on market movement below the 65-period moving average to gain insights into the conclusion of the market rebound.
Insights from the 1-Hour Chart
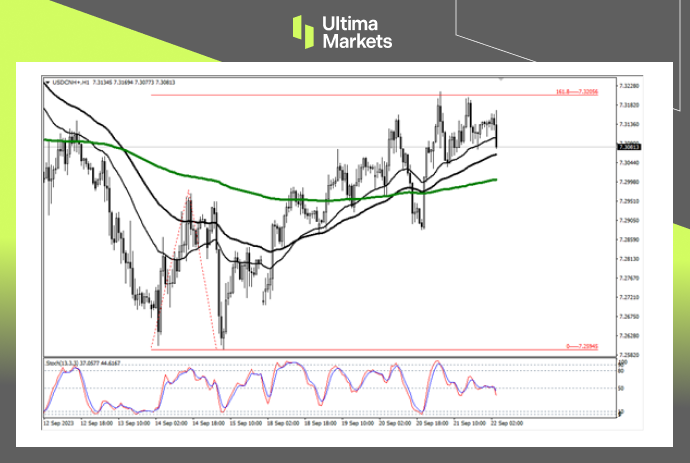
(1-hour chart of USD/CNH, source: Ultima Markets MT4)
Equilibrium in the Market: On the 1-hour chart, the moving average remains a pivotal support for the market.
The stochastic oscillator hovers around the middle area at 50, indicating an equilibrium between bullish and bearish sentiments.
To confirm the initiation of short positions, a market movement below the moving average group is crucial.
Ultima Markets Pivot Indicator
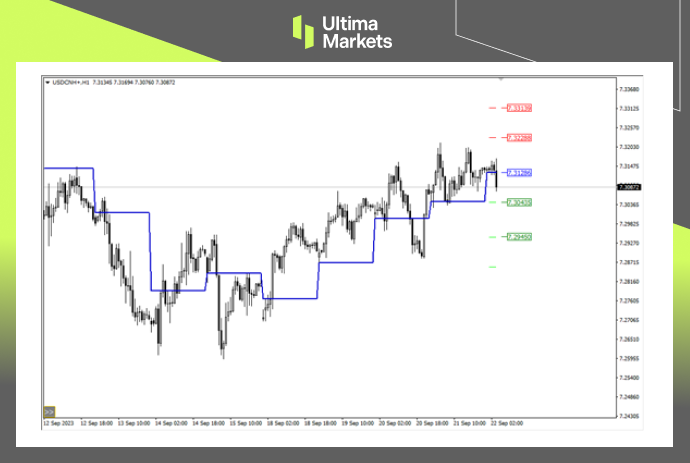
(1-hour chart of USD/CNH, source: Ultima Markets MT4)
Key Price Level: According to the pivot indicator in Ultima Markets MT4, the central price for the day stands at 7.31286.
A bullish sentiment prevails above this level, with the first target at 7.32288 and the second target at 7.33139.
Conversely, a bearish stance is favored below 7.31286, with the first target at 7.30435 and the second target at 7.29450.
Conclusion
Written on September 22, 2023 at 11:22 am, by mervin
Comments Off on Focus On USD/CNH Today – 22nd Sep 2023
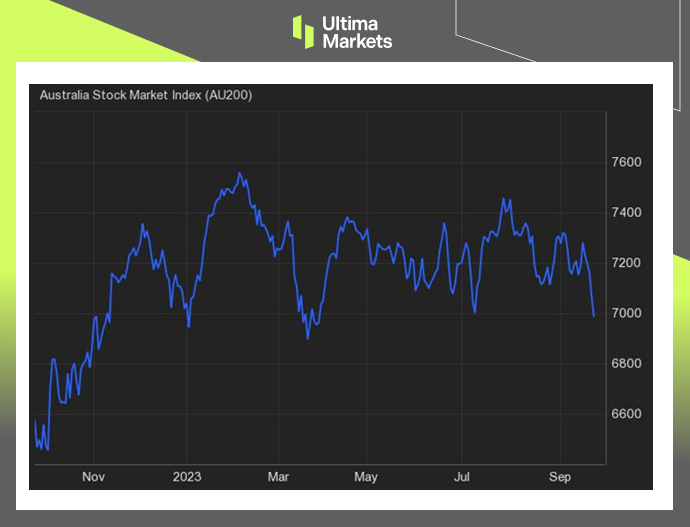
The ASX 200 Index tumbled 1.3% to below 7,000 on Sep. 22, hitting its lowest levels in six months and tracking losses on Wall Street overnight as the US Federal Reserve’s hawkish pause continued to weigh on investor sentiment.
The benchmark index is also on track to lose nearly 5% this week for its second consecutive weekly decline. Domestically, investors digested data showing Australia’s manufacturing activity contracted further in September, while services activity turned expansionary.
Impact on Key Sectors
Commodity-linked stocks led the decline with sharp losses from BHP Group (-2%), Rio Tinto (-2.3%), Fortescue Metals (-2.2%), Woodside Energy (-0.9%) and Newcrest Mining (-0.9%). Heavyweight financial, technology, and consumer-related firms slumped as well.
(ASX 200 Index daily chart)
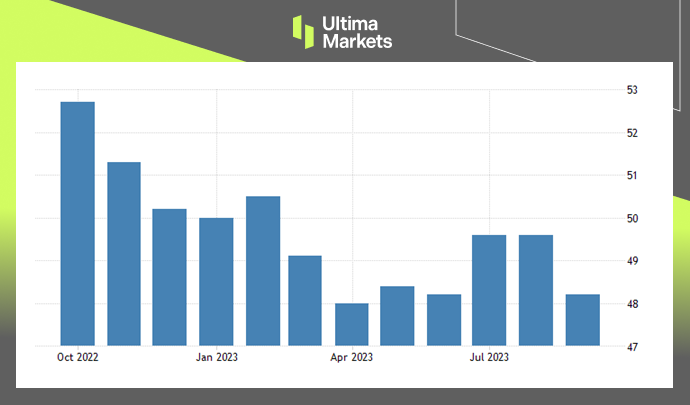
The Judo Bank Flash Australia Manufacturing PMI
The Judo Bank Flash Australia Manufacturing PMI fell to 48.2 in September 2023, from 49.6 in the previous month, flash estimates showed. It pointed to the lowest reading in 4 months, indicating continued deteriorating business conditions across the sector.
Inflation and Pricing Strategies
A sharper fall in new orders led to manufacturing output shrinking for a tenth straight month in September. Consequently, firms reduced their purchasing activity and inventory holdings.
That said, employment levels rose with some manufacturers still facing a shortage of labor to support ongoing operations. Staffing constraints also led to a marginal lengthening of lead times.
Input cost inflation eased amid the drop in purchasing activity, while firms also raised their own selling prices at a slower rate.
(Judo Bank Australia Manufacturing PMI, S&P Global)
Implications and Conclusion
In conclusion, the ASX 200 Index’s recent nosedive results from a complex interplay of domestic and international factors.
The US Federal Reserve’s hawkish stance, along with domestic issues, especially the manufacturing sector’s contraction, has deepened economic uncertainties.
While challenges persist, businesses have demonstrated resilience in adapting to the evolving landscape.
In this volatile market, comprehending the intricacies of the ASX 200 Index’s journey is vital for investors and analysts alike.
Disclaimer
Comments, news, research, analysis, price, and all information contained in the article only serve as general information for readers and do not suggest any advice. Ultima Markets has taken reasonable measures to provide up-to-date information, but cannot guarantee accuracy, and may modify without notice. Ultima Markets will not be responsible for any loss incurred due to the application of the information provided.
Written on September 22, 2023 at 11:12 am, by mervin
Comments Off on Decoding the ASX 200 Index Plunge: A Hierarchical Analysis
For investors investing in China’s A-shares, the performance of China’s stock market so far this year has only been slightly impressive at the beginning of the year. However, as China’s economic recovery gradually falls short of expectations, and the exchange rate of CNY/USD continues to fall, the performance of A-shares has also declined. Although there are frequent rumors in the market that China will launch large-scale stimulus, it turns out there is always loud thunder but little rain.
On August 27, the China Securities Regulatory Commission finally introduced a series of favorable policies such as halving stamp. However, at the opening of the next day, the three major A-share stock indexes only rose for a short period of about 1 minute, then fell back one after another. As a result, many Chinese netizens commented: “I’m optimistic about the fate of the country but choose to bet on the Nasdaq.”
In today’s turbulent international political and economic situation, can China’s A-shares break out of the siege and turn the tide? This article will take you to find out.
Why the large stimulus isn’t coming?
In addition to the need to wait for the RMB exchange rate to strengthen, whether China can introduce large-scale stimulus measures is also an important factor in the strength of the A-shares market. However, it seems that China is quite conservative about the introduction of stimulus measures. Not only is the intensity of the stimulus measures currently introduced not large, but the speed of introduction is as fast as squeezing out toothpaste, and China has not shown that it plans to launch large-scale stimulus.
On September 15, the People’s Bank of China decided to lower the deposit reserve ratio of financial institutions by 0.25 percentage points for the second time this year. Although it lowered the required reserve ratio, it did not lower interest rates. Therefore, the market reaction was also calm. In the end, the Shanghai Composite Index even closed down 0.28% that day. It can be seen that the so-called rescue efforts obviously did not meet market expectations.
So here comes the question. Since the market now knows that large-scale stimulus will likely solve the current predicament of A-shares, why is there still no such stimulus?
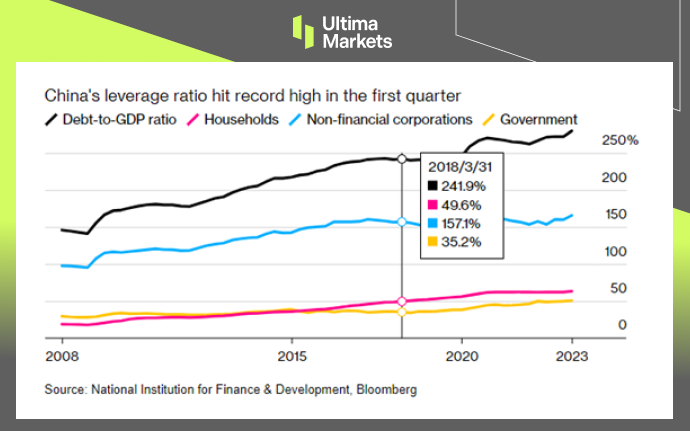
Just in mid-August, Ray Dalio, the founder of Bridgewater Associates, the world’s largest hedge fund, publicly stated that China is in urgent need of reducing leverage. His remarks may explain why China has been slow to introduce large stimulus policies. As we all know, debt is a double-edged sword. When maintained at the right level, it can provide upward momentum for national economic growth. However, once the critical threshold is exceeded, debt will undoubtedly have a negative impact on the economy.
In fact, as early as a few years ago, China had begun to continuously publicize that it would embark on a “road to deleveraging.” In 2018, China’s macro leverage ratio was about 240%. However, in recent years, with the outbreak of the epidemic and changes in the economic situation, the leverage ratio has not only not declined, but has risen to about 280%. Therefore, although large-scale stimulus policies are almost the only prescription to boost China’s stock market in the short term, China will obviously remain cautious about stimulus policies under the urgent need to reduce leverage.
China’s leverage ratio has remained high for several years.
Can A-shares get better in the future?
Since it is difficult to implement stimulus measures on a large scale at the moment, does this mean that A-shares are hopeless? Whenever this happens, you will definitely hear some so-called stock commentators say: “Although A-shares are under pressure in the short term, their long-term fundamentals are good.” In our opinion, such similar remarks are probably just half true. Although A-shares are under pressure in the short term, their long-term fundamentals may not be completely positive.
Why? To answer this question, we must start with the composition of A-shares.
If we talk about the market capitalization leaders or star stocks in A-shares, investors may first think of consumer or financial banking stocks such as Kweichow Moutai, Ping An, and Industrial and Commercial Bank of China. Correspondingly, when talking about the leading stars of the US stock market, Apple, Tesla, Nvidia, Amazon, etc. may come to mind, but these companies basically belong to the technology industry.
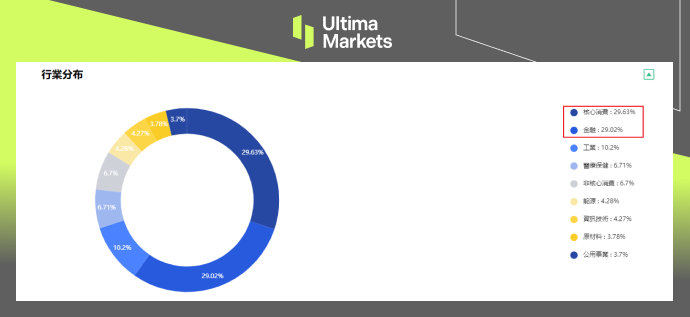
In fact, this stereotype aligns with the current status of the A-share and US stock markets. Let’s take the FTSE China A50 Index (composed of the top 50 A-share stocks by market capitalization) as an example. The figure below shows that among the top 50 stocks by market capitalization, the financial industry accounts for 28.25%, and the core consumer industry accounts for 30.77%. These two major industries undoubtedly occupy the majority.
Breakdown of industries in FTSE A50 Index
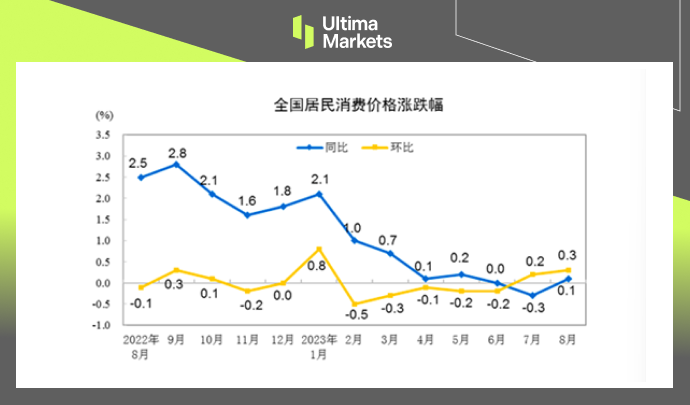
But the problem lies precisely with these two industries. The first is the consumer industry. Since China has continued to show a “consumption downturn” this year, the consumer industry will naturally bear the brunt of the impact. This can also be reflected in the rise and fall of CPI (Consumer Price Index). As can be seen from the chart below, since entering 2023, China’s CPI trend, if not a recessionary trend, has at least shown a sideways trend. And this is naturally not good news for the core consumer industry. Consumption needs a trend toward inflation to realize that consumer prices can rise, allowing relevant companies to reap higher profits. But once the consumption level falls into a sideways situation, the relevant company’s growth expectations will naturally be greatly restricted.
Rise and fall of China’s CPI in the past year.
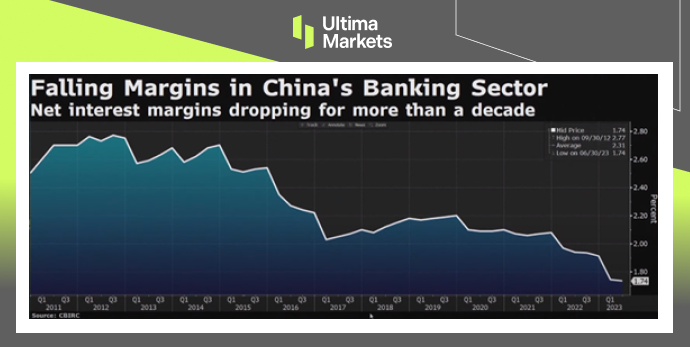
Then, let’s talk about the financial industry. Financial stocks in China’s A-share market are actually mainly banking stocks such as China Merchants Bank, Industrial and Commercial Bank of China, and Agricultural Bank of China. In the current economic environment in China, the growth expectations of bank stocks are subject to a key factor, which is net interest margin. The so-called net interest margin refers to the ratio of the bank’s net interest income to the bank’s total interest-earning assets. To put it simply, the net interest margin is equivalent to the profit margin of the banking industry. The higher the net interest margin, the higher the bank’s profitability and vice versa.
The chart below shows the net interest margin trend of China’s banking industry since 2011. As can be seen from the figure, the net interest margin of China’s banking industry has shown a clear downward trend in the past 10 years. And this is naturally not a good thing for banks that rely on net interest margins to make profits.
Trend of net interest margin of China’s banking industry since 2011.
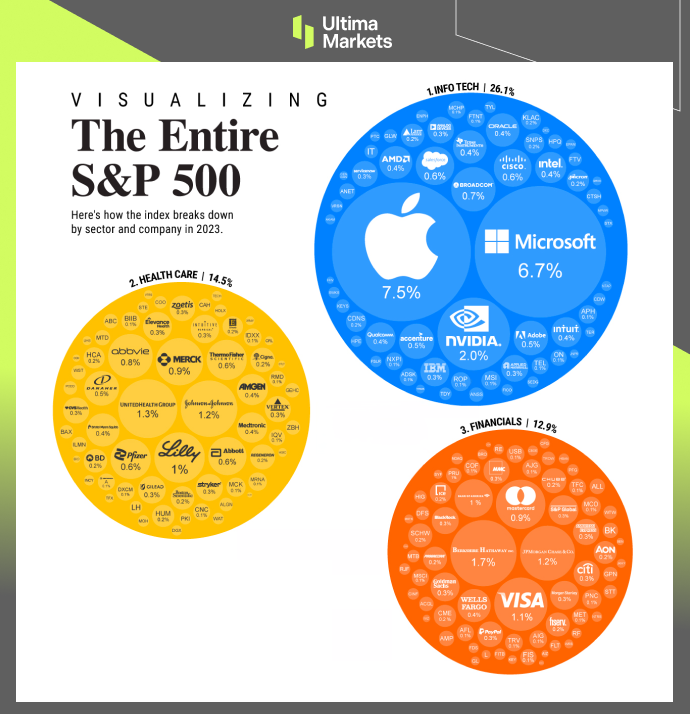
All in all, the current market structure of A-shares is basically dominated by the consumer industry and the financial and banking industries, and such a market structure is unable to support a higher market value. If A-shares really want to rival U.S. stocks in the future and achieve a long-term bull market, they will inevitably need to let their leading market value companies gradually shift to high-value-added industries such as the technology industry or the medical industry. Only by allowing these industries to take a dominant position can A-shares truly achieve “good long-term fundamentals.”
Breakdown of industries of shares in S&P 500 Index
When the A-shares markets can rebound?
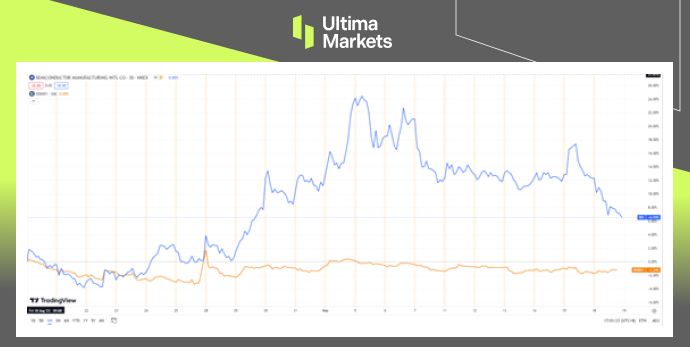
So can A-shares make those high-value-added technology industries the market capitalization leaders in the future? Combined with the continuous technological blockade imposed by the United States and other Western countries on China in recent years, it seems that there is little hope of achieving this goal. But what is surprising is that Huawei, which has been subject to US technology sanctions for four years, suddenly released the latest Mate 60 series mobile phones in a low-key manner without any publicity and promotion. Confirmed by Bloomberg News, its SoC adopts the 7nm process and is manufactured by SMIC. For China’s technology industry, this is undoubtedly the first glimmer of light after a long dark night. The blue line in the figure below represents the trend of SMIC share price in the Hong Kong stock market in the past month, while the orange line represents the trend of the Shanghai Composite Index during the same period.
The comparison of SMIC and Shanghai Composite Index in the past month
As we all know, China’s rapid economic development in the past two decades began with the real estate economy led by land finance. In combination with the foreign trade export industry, which was originally labor-intensive, it also created jobs for the city, thereby promoting urbanization development. However, as the international economic situation has become more turbulent in recent years, the demand for imported goods from China to developed countries such as Europe and the United States has continued to decline. The export-oriented export industries in the past have been hit first, which in turn has reduced urban employment, thus further accelerating the growth of China’s real estate industry.
Therefore, given China’s current economic situation, continuing to follow the old path of land finance or mid- to low-end foreign trade exports is definitely not a long-term option. If China wants to reverse its current sluggish economy and A-share dilemma, industrial upgrading is the only way. Because in the macro division of labor in the international industrial chain, using the so-called cheap demographic dividend to develop foreign trade OEM production is inherently the lowest-profit link. Only by occupying high-end links such as R&D and design and changing China’s current position in the international industrial chain can it bring more income to the overall economy and individual consumers. Only when incomes begin to truly increase and people’s expectations for the future improve, will China’s economy and the A-share market truly improve.
Summary
The Chinese market needs large-scale stimulus in the short term, but the large stimulus will not be conducive to long-term development. Therefore, the current stimulus measures introduced by China are relatively restrained, and the actual intensity is not particularly large.
Since the current industry structure of the A-share market is mainly focused on finance banking or consumption, and lacks high-value-added industries, it is impossible to essentially improve the long-term market conditions of A-shares.
Only by accelerating industrial upgrading can fundamentals of A-shares market truly improve in the future.
Disclaimer
The comments, news, research, analyses, prices, and all information contained in this article can only be regarded as general information and are provided only to help readers understand the market situation and do not constitute investment advice. Ultima Markets has taken reasonable steps to provide up-to-date information, but cannot guarantee the accuracy and may modify without notice. Ultima Markets will not be responsible for any loss incurred due to the application of the information provided.
Written on September 21, 2023 at 4:05 pm, by mervin
Comments Off on When China’s A-Shares Markets Can Bounce Back?