Important Information

This website is managed by Ultima Markets’ international entities, and it’s important to emphasise that they are not subject to regulation by the FCA in the UK. Therefore, you must understand that you will not have the FCA’s protection when investing through this website – for example:

  • You will not be guaranteed Negative Balance Protection
  • You will not be protected by FCA’s leverage restrictions
  • You will not have the right to settle disputes via the Financial Ombudsman Service (FOS)
  • You will not be protected by Financial Services Compensation Scheme (FSCS)
  • Any monies deposited will not be afforded the protection required under the FCA Client Assets Sourcebook. The level of protection for your funds will be determined by the regulations of the relevant local regulator.

Note: Ultima Markets is currently developing a dedicated website for UK clients and expects to onboard UK clients under FCA regulations in 2026.

If you would like to proceed and visit this website, you acknowledge and confirm the following:

  • 1.The website is owned by Ultima Markets’ international entities and not by Ultima Markets UK Ltd, which is regulated by the FCA.
  • 2.Ultima Markets Limited, or any of the Ultima Markets international entities, are neither based in the UK nor licensed by the FCA.
  • 3.You are accessing the website at your own initiative and have not been solicited by Ultima Markets Limited in any way.
  • 4.Investing through this website does not grant you the protections provided by the FCA.
  • 5.Should you choose to invest through this website or with any of the international Ultima Markets entities, you will be subject to the rules and regulations of the relevant international regulatory authorities, not the FCA.

Ultima Markets wants to make it clear that we are duly licensed and authorised to offer the services and financial derivative products listed on our website. Individuals accessing this website and registering a trading account do so entirely of their own volition and without prior solicitation.

By confirming your decision to proceed with entering the website, you hereby affirm that this decision was solely initiated by you, and no solicitation has been made by any Ultima Markets entity.

I confirm my intention to proceed and enter this website Please direct me to the website operated by Ultima Markets , regulated by the FCA in the United Kingdom

Global Upstream Exchange Technical Disruption – Impact on Selected Products

Dear Valued Client,

Due to abnormal liquidity conditions in gold caused by this disruption, we have temporarily suspended trading for all gold instruments with immediate effect.

We are writing to keep you fully informed that a technical disruption currently affecting upstream global exchange, which has resulted in interruptions to pricing and trading for several international derivatives markets.

Please be advised that this is an industry-wide incident originating from an external provider and is unrelated to our platform or price movements.During this time, clients may experience price delays, order rejections, or temporary constraints on order execution.

We understand that seamless execution is vital to your trading. We have activated our emergency monitoring protocols and are tracking the recovery progress in real-time. We will send a follow-up notification immediately once services are fully operational.

We sincerely apologize for the inconvenience caused by this external event, and our support team remains on standby to assist you should you require any assistance.

Thank you for your understanding.

Close Pop-up

BYD Surpasses Ford in August 2023 Car Sales: Industry Insights 


BYD Overtakes Ford in August Car Sales: What Does It Mean for the Auto Industry?

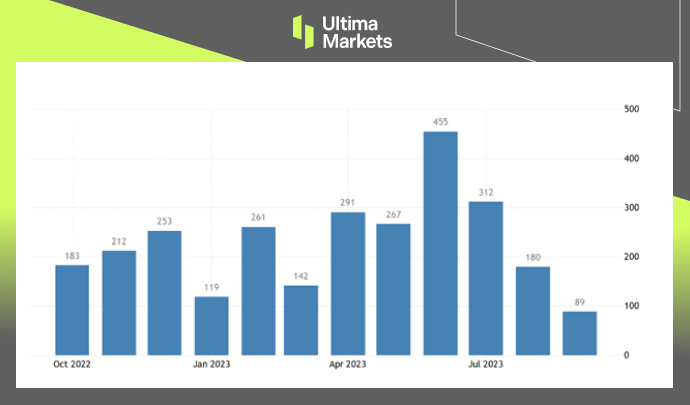
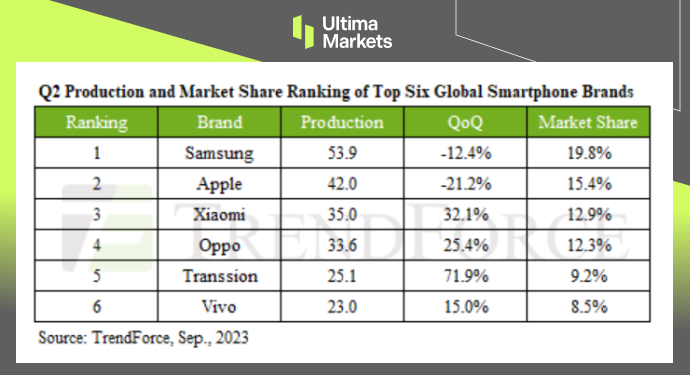
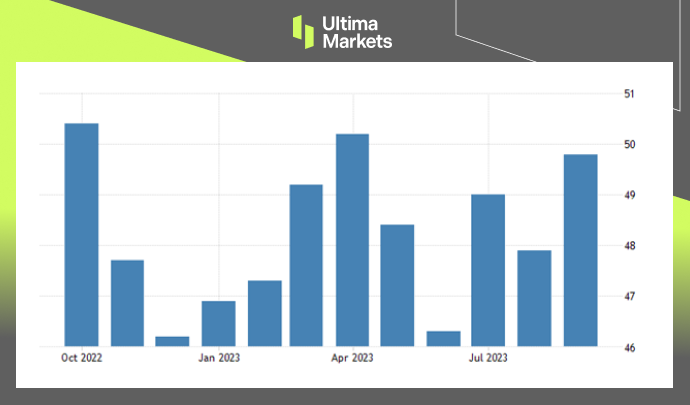
According to TrendForce report, car sales in 37 markets around the world totaled 5.55 million units in August 2023, an increase of nearly 1% from July. The growth momentum came from the launch of new models for the autumn. 

A table shows the August Ranking of Auto Brand Sales Share.

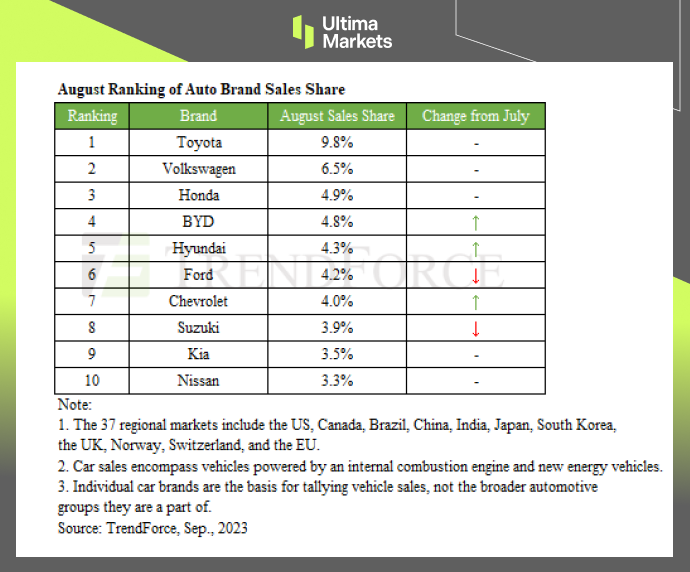
(August Ranking of Auto Brand Sales Share)

The composition of the top ten brands is the same as last month. The top three are Toyota, Volkswagen, and Honda. The Chinese car manufacturer BYD replaced Ford and became the fourth-largest brand in August car sales.


BYD’s Remarkable Growth

BYD has converted all its models to new energy vehicles, so the lukewarm domestic demand in the Chinese market has less impact on it. BYD recorded a MOM growth of 5%, and the market share was only 0.1% behind the third-placed Honda.

However, Japanese car manufacturers also have contributions from markets such as Southeast Asia. Consequently, for BYD to surpass Honda in the global market, the key is its expansion speed in overseas markets.


Ford’s Decline in August Sales

Ford’s ranking fell to sixth place due to lower sales in Europe and the United States compared with the previous month, with sales declining by 6.7% month-on-month.  


Challenges and Variables in 2H23

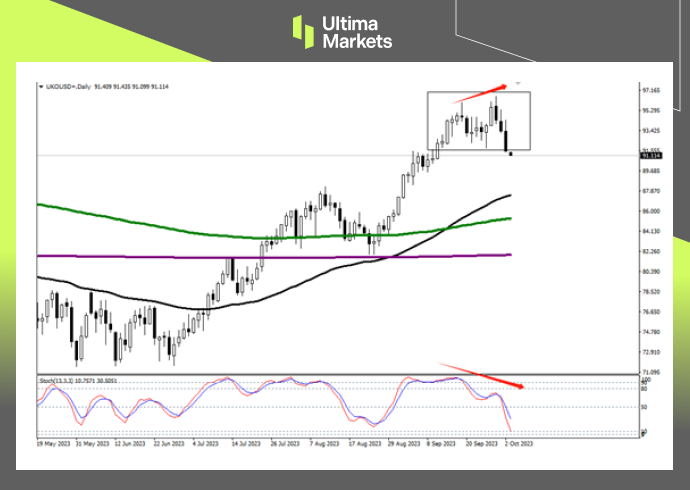
Although the launch of autumn models will help new car sales, there are still many variables in 2H23, including the United Auto Workers (UAW) strike that has not yet ended; OPEC+ allies’ crude oil production cuts, etc.


Strategies for the Fourth Quarter

As the fourth quarter approaches, auto manufacturers will do their best to ensure smooth production, fulfill orders, and stimulate year-end sales, minimizing the impact of reduced order visibility caused by economic changes. 


Disclaimer  

Comments, news, research, analysis, price, and all information contained in the article only serve as general information for readers and do not suggest any advice. Ultima Markets has taken reasonable measures to provide up-to-date information, but cannot guarantee accuracy, and may modify without notice. Ultima Markets will not be responsible for any loss incurred due to the application of the information provided. 

Focus on USDX Today – 6th October 2023


Comprehensive USDX Analysis for October 6, 2023

In this comprehensive analysis, Ultima Markets brings you an insightful breakdown of the USDX for 6th October 2023. 


The Core: Fundamental Factors

  • ADP Employment Data: Recent ADP employment data showed a significant drop below expectations. This is a crucial indicator of labor market dynamics.
  • Historically Low Jobless Claims: The announcement of 207,000 initial jobless claims last week, still at a historical low, underscores the robustness of the job market.
  • Fewest Quarterly Layoffs: U.S. companies have reported the fewest quarterly layoffs in a year due to strong seasonal hiring plans. This is a significant positive signal for the economy.

The Turning Point: Interest Rates

The above factors collectively raise questions about the possibility of interest rate adjustments in the near future. The final decision hinges on the impending release of US non-farm employment data, due tonight. This data will be pivotal in shaping the USDX’s trajectory.


The Technical Aspect: USDX Trends

  • Daily Chart Trends: On the daily chart, the US dollar index has experienced a two-day decline. The stochastic oscillator’s dead cross in the overbought area suggests a short-term downtrend.
  • Bearish Trend: To confirm a bear trend, it’s crucial for the USDX to break effectively below its recent lows. The initial target rests near the blue 17-day moving average.
  • Hourly Chart Insights: On the hourly chart, the market has breached the support level around 106.23. The ATR combination indicator confirms this breakdown.
  • Pivot Indicator: As per Ultima Markets’ pivot indicator, the central price for the day is 106.200.

Daily chart of USDX

Daily Chart of USDX by Ultima Markets MT4

(Daily chart of USDX, source: Ultima Markets MT4) 


1-hour chart of USDX

Although it has increased the probability of a bear trend, it still needs to wait for the U.S. dollar index to effectively fall below the lowest price. The price may be relatively limited. The first target is near the blue 17-day moving average. 

1-hour chart of USDX by Ultima Markets

(1-hour chart of USDX, source: Ultima Markets MT4) 


Pivot Indicators

On the 1-hour chart, the market fell below the support level around 106.23, and the ATR combination indicator hinted at the effectiveness of the breakdown. Waiting for the price to retreat and see if there is any chance of further downward movement. 

Pivot Indicators for USDX

(Pivot Indicators for USDX, source: Ultima Markets MT4)


Potential Scenarios

According to the pivot indicator in Ultima Markets MT4, the central price of the day is 106.200. 

  • Bullish Above 106.200: If the USDX remains above 106.200, the first target is 106.363, with a secondary target at 106.755.
  • Bearish Below 106.200: In case the USDX dips below 106.200, the initial target is 105.805, with a secondary target at 105.640.


Legal Documents 

Ultima Markets, a trading name of Ultima Markets Ltd, is authorized and regulated by the Financial Services Commission “FSC” of Mauritius as an Investment Dealer (Full-Service Dealer, excluding Underwriting) (license No. GB 23201593). The registered office address: 2nd Floor, The Catalyst, 40 Silicon Avenue, Ebene Cybercity, 72201, Mauritius. 

Disclaimer   

Comments, news, research, analysis, price, and all information contained in the article only serve as general information for readers and do not suggest any advice. Ultima Markets has taken reasonable measures to provide up-to-date information, but cannot guarantee accuracy, and may modify without notice. Ultima Markets will not be responsible for any loss incurred due to the application of the information provided.

Copyright © 2023 Ultima Markets Ltd. All rights reserved. 

USD’s Response to ADP® National Employment’s Sep’23 Report


Disappointing ADP Job Report’s Impact on USD | October 2023 Analysis

According to ADP® National Employment’s September 2023 Report, Private businesses in the US hired 89K workers in September 2023, the least since January 2021 when private employers shed jobs, and well below market forecasts of 153K. It follows a revised 180K increase in August, compared to an initial 177K.

Large establishments drove the slowdown, losing 83K jobs and wiping out gains they made in August. On the other hand, small companies added 95K jobs and mid-sized ones 72K. Meanwhile, annual wage growth slowed to 5.9%, the 12th consecutive monthly decline. Pay gains also shrank for job changers to 9%. 

US Employment Changes, ADP

(US Employment Changes, ADP)

The dollar index fell below the 107.0 mark on Wednesday, following the release of a disappointing ADP jobs report. Nevertheless, the dollar remained near its strongest level since November 2022, bolstered by hawkish comments from Fed officials that continue to reinforce expectations of elevated interest rates for an extended period. 

U.S. Dollar Index DXY

(U.S. Dollar Index DXY)


Disclaimer  

Comments, news, research, analysis, price, and all information contained in the article only serve as general information for readers and do not suggest any advice. Ultima Markets has taken reasonable measures to provide up-to-date information, but cannot guarantee accuracy, and may modify without notice. Ultima Markets will not be responsible for any loss incurred due to the application of the information provided. 

Focus on USD/CAD Today – 5th October 2023

Comprehensive USD/CAD Analysis For October 5, 2023

In this comprehensive analysis, Ultima Markets brings you an insightful breakdown of the USD/CAD for 5th October 2023. 


Key Takeaways

  • U.S. Economic Data: The release of subpar U.S. economic data acted as a catalyst for market movements. This data sent shockwaves through the forex market, causing traders to react by selling off the U.S. dollar.
  • Crude Oil Market: Another significant factor was the impending destruction of crude oil demand. This development, coupled with the gloomy macroeconomic outlook, played a substantial role in shaping the forex landscape. As crude oil prices began to fall, the depreciation of currencies in energy-exporting countries gained momentum.
  • Canadian Dollar’s Depreciation: The Canadian dollar, in particular, saw a short-term depreciation trend that intensified due to the interplay of these factors.

USD/CAD Technical Analysis

USD/CAD Weekly Chart

The weekly chart of USD/CAD in October 2023 revealed a pivotal development. The closing line for the week was on the verge of breaking through the suppression of the downward trend line, which had been in place since October of the previous year. Furthermore, the stochastic oscillator was on the cusp of reaffirming the upward trend.

USD/CAD Weekly Chart

(Weekly chart of USD/CAD, source: Ultima Markets MT4) 


USD/CAD 4-Hour Chart Analysis

Zooming in on the 4-hour chart, we identified a weakening of prices following the recent breach of the weekly downward trend line. The stochastic oscillator displayed a divergent downward trend, indicating that the exchange rate was likely entering an adjustment cycle.

USD/CAD 4-Hour Chart Analysis

(4-hour chart of USD/CAD, source: Ultima Markets MT4) 


USD/CAD 1-Hour Chart Insights

On the 1-hour chart, the 23.6% retracement level at 1.36923 emerged as an extremely critical support price. This level could potentially mark the end of the downward trend. Conversely, falling below this level would signify a breach of the weekly downward trend line, casting doubts on the legitimacy of the recent upward trend.

USD/CAD 1-Hour Chart Insights

(1-hour chart of USD/CAD, source: Ultima Markets MT4) 


USD/CAD Pivot Indicator

(1-hour chart of USD/CAD, source: Ultima Markets MT4) 

According to the pivot indicator in Ultima Markets MT4, the central price of the day was 1.37375. 

  • Bullish above 1.37375, the first target is 1.37846, the second target is 1.38264 
  • Bearish below 1.37375, first target 1.36966, second target 1.36495 

Conclusion

In conclusion, October 2023 brought about a series of significant fundamental and technical developments in the USD/CAD forex market. Traders were faced with key decision points, influenced by a variety of factors, from U.S. economic data to crude oil prices.

The forex market remains inherently volatile, emphasizing the importance of informed, strategic, and responsive trading decisions.

At Ultima Markets, we are committed to providing valuable market insights to empower your trading decisions.

While this article offers a comprehensive overview of the USD/CAD situation in October 2023, it’s essential to keep a watchful eye on market developments and continue refining your trading strategies to stay ahead in the competitive world of forex trading.


Legal Documents 

Ultima Markets, a trading name of Ultima Markets Ltd, is authorized and regulated by the Financial Services Commission “FSC” of Mauritius as an Investment Dealer (Full-Service Dealer, excluding Underwriting) (license No. GB 23201593). The registered office address: 2nd Floor, The Catalyst, 40 Silicon Avenue, Ebene Cybercity, 72201, Mauritius. 

Disclaimer

Comments, news, research, analysis, price, and all information contained in the article only serve as general information for readers and do not suggest any advice. Ultima Markets has taken reasonable measures to provide up-to-date information, but cannot guarantee accuracy, and may modify without notice. Ultima Markets will not be responsible for any loss incurred due to the application of the information provided.

Copyright © 2023 Ultima Markets Ltd. All rights reserved. 

Global mobile phone shipments may continue to slide in 2H23 on weak demand 


Global Mobile Phone Production Decline in 2H23: Insights and Analysis

According to a TrendForce survey, after global smartphone production fell by nearly 20% year-on-year in the first quarter, production continued to decline by approximately 6.6% in the second quarter, to only 270 million units.

A total of 520 million smartphones were produced in the first half of 2023, a 13.3% decline compared to the same period last year. Both individual quarters and the first half of the year in total set a ten-year low. 


Factors Influencing Mobile Phone Production Decline

There are three reasons for the sluggish production performance:

1. China’s lifting of epidemic prevention restrictions has not boosted demand as expected.

2. The demographic dividend effect of the emerging Indian market has not effectively exerted its advantages. 

3. In 2022, brand names were severely hampered by excessive channel inventory. It was originally expected that as the inventory reduced, brand names would have returned to normal production levels. However, affected by the weak economy, people’s consumption willingness is more conservative, resulting in production performance in the first half of the year being less than expected. 


Top Six Global Smartphone Brands Challenges and Channel Inventory

(2Q23 global smartphone production and market share ranking) 

Samsung’s production performance in the second quarter was not as good as the same period last year. The total production in the second quarter was 53.9 million units, a quarter-on-quarter decrease of 12.4%, but it still ranked first in production.  

Apple is facing the transition of new and old models. The second quarter is probably the lowest production performance among the four quarters, with output of 42 million units, a quarter-to-quarter decrease of 21.2%. It is worth noting that Samsung and Apple are quite close in their full-year production forecasts. If the iPhone 15 series performs better than market expectations, it may overtake Samsung to become the number one brand in the global market.

Xiaomi’s output in the second quarter was approximately 35 million units, a quarterly increase of 32.1%, driven by the gradual decline in channel inventory and the launch of new models.  

A special change in the ranking is that Transsion overtook Vivo and entered fifth place in the world for the first time. Its production volume increased by more than 70% quarter-on-quarter to 25.1 million units.  


Outlook for the Global Smartphone Market

The overall economy has not fully recovered in the second half of the year, and demand in consumer markets such as China, Europe and the United States has not yet recovered significantly. Even if the economic indicators of the Indian market improve, it is still difficult to reverse the decline in global smartphone production.  


Disclaimer  

Comments, news, research, analysis, price, and all information contained in the article only serve as general information for readers and do not suggest any advice. Ultima Markets has taken reasonable measures to provide up-to-date information, but cannot guarantee accuracy, and may modify without notice. Ultima Markets will not be responsible for any loss incurred due to the application of the information provided. 

Focus on GBP/NZD Today – 4th October 2023

Comprehensive GBP/NZD Analysis for October 4, 2023

In this comprehensive analysis, Ultima Markets brings you an insightful breakdown of GBP/NZD for 4th October 2023. 


Key Insight: RBNZ Interest Rate Decision and Economic Outlook

  • RBNZ Decision: The Reserve Bank of New Zealand (RBNZ) has opted to maintain the interest rate at 5.50%.
  • Consistency: Notably, this marks the third consecutive time that the central bank has refrained from adjusting interest rates.
  • GDP Growth: Despite a stronger-than-expected GDP growth in the June quarter, the overall growth outlook remains subdued.
  • Global Economic Risks: The RBNZ Committee has expressed concerns about downside risks to the global economic growth outlook in the medium term.
  • Short-Term Currency Trends: In the short term, the New Zealand dollar may face a depreciation trend.

Technical Analysis: A Closer Look on GBP/NZD Trading Charts


GBP/NZD Daily Chart Insights

Reversal Structure: The daily chart illustrates a clear reversal structure, with the 240-day moving average acting as a significant resistance point.

GBP/NZD Daily Chart Insights by Ultima Markets MT4

( Daily chart of GBP/NZD, source: Ultima Markets MT4) 

The stochastic oscillator technical indicator has also left the oversold area after being oversold for nearly 9 trading days. The market may continue to rebound and rise today. 


GBP/NZD 4-Hour Chart Observations

  • Motive Wave: A five-wave upward structure has emerged since the end of September, signaling a potential motive wave.
  • Moving Average Test: The market has surged rapidly and is nearing the 65-period moving average, a level to monitor for potential breakout.
GBP/NZD 4-Hour Chart Observations by Ultima Markets MT4

(4-hour chart of GBP/NZD, source: Ultima Markets MT4) 


Pivot Indicator

Pivot Indicator by Ultima Markets MT4

(1-hour chart of GBP/NZD, source: Ultima Markets MT4) 

Central Price: According to Ultima Markets MT4 pivot indicator, the central price for the day stands at 2.04099.

  • Bullish Outlook: A price movement above 2.04099 could trigger an upward momentum, targeting 2.05336 as the first level of resistance and 2.06164 as the second.
  • Bearish Outlook: A dip below 2.04099 may indicate a bearish trend, with the first support level at 2.03301 and the second at 2.02075.


Legal Documents 

Ultima Markets, a trading name of Ultima Markets Ltd, is authorized and regulated by the Financial Services Commission “FSC” of Mauritius as an Investment Dealer (Full-Service Dealer, excluding Underwriting) (license No. GB 23201593). The registered office address: 2nd Floor, The Catalyst, 40 Silicon Avenue, Ebene Cybercity, 72201, Mauritius. 

Disclaimer

Comments, news, research, analysis, price, and all information contained in the article only serve as general information for readers and do not suggest any advice. Ultima Markets has taken reasonable measures to provide up-to-date information, but cannot guarantee accuracy, and may modify without notice. Ultima Markets will not be responsible for any loss incurred due to the application of the information provided.  

Copyright © 2023 Ultima Markets Ltd. All rights reserved. 

US PMI Improved, But Stagnant Inflation Loomed 


US Manufacturing PMI Shows Improvement, but Stagnant Inflation Remains a Concern

The ISM manufacturing purchasing managers’ index rose to 49 in September from 47.6 last month, well above market expectations of 47.8, reflecting the slowest contraction in the U.S. manufacturing industry in ten months.

Even as the economic slowdown improved, data still showed U.S. factory activity contracting on a month-on-month basis for nearly a year in a row, underscoring the impact of rising borrowing costs from the Federal Reserve on the industry.


Although new orders fell for the 13th consecutive month, the pace of decline slowed significantly as the changing supply chain environment pushed customers to take on more engineering (process).

Production rebounded from August’s stagnation and set the largest increase since July 2022. 

(ISM Manufacturing PMI, Institute for Supply Management) 


S&P Global US Manufacturing PMI

The S&P Global US Manufacturing PMI was revised higher to 49.8 in September 2023, surpassing the preliminary estimate of 48.9 and exceeding August’s final reading of 47.9.

The latest figure pointed to a fifth consecutive month of contraction in the sector’s health, albeit only fractional. Output increased at a marginal pace that was nonetheless the fastest since May.

In contrast, job creation remained moderate, and new orders continued to decline for the fifth consecutive month, reflecting the impact of high interest rates and inflation on consumer demand.


Inflation and Business Confidence

On the price front, both input costs and output charges accelerated, though inflation rates remained historically low, well below the levels seen over the past three years.

Moreover, business confidence reached its highest level since April 2022, driven by optimism about an impending improvement in demand conditions.  


Stagnant Inflation (Stagflation)

(US Manufacturing PMI, S&P Global) 

Based on the surveys, although survey data have improved overall, manufacturing reports show that production continues to slow down, and prices are accelerating again. The phenomenon presented is “stagnant inflation (Stagflation)“.


Disclaimer  

Comments, news, research, analysis, price, and all information contained in the article only serve as general information for readers and do not suggest any advice. Ultima Markets has taken reasonable measures to provide up-to-date information, but cannot guarantee accuracy, and may modify without notice. Ultima Markets will not be responsible for any loss incurred due to the application of the information provided. 

Focus on Brent Oil Today – 3rd October 2023 


Comprehensive Brent Oil Analysis for October 3, 2023

In this comprehensive analysis, Ultima Markets brings you an insightful breakdown of the Brent Oil (UKOUSD) for 3rd October 2023. 


Key Takeaways

Key Point: The lifting of the U.S. government shutdown crisis, coupled with robust PMI data, has driven the U.S. dollar index to 107, a level not seen since November last year. This surge in the dollar’s strength has led to a sharp decline in non-U.S. currencies and a corresponding dip in crude oil prices, reaching three-week lows.

  • Increased OPEC Production: Notably, OPEC’s oil production increased by 120,000 barrels per day in September compared to August, reaching 27.73 million barrels per day for the second consecutive month.
  • Bearish Sentiment Emerges: Concerns over increased supply and the impact of high interest rates on demand have prompted bearish sentiment in the crude oil market.

Brent Oil Technical Analysis


Brent Oil Daily Chart Analysis

Brent Oil Daily Chart Analysis By Ultima Markets MT 4

( Daily chart of BRENT OIL, source: Ultima Markets MT4) 

Key Point: The daily chart reveals a rapid decline in crude oil prices, signaling a strong bearish trend.

Stochastic Oscillator Signals

Key Point: Stochastic oscillator technical indicators suggest a divergence from market prices, indicating a high probability of short-term bearishness.


Brent Oil 1 Hour Chart Analysis

Brent Oil 1 Hour Chart Analysis by Ultima Markets MT4

(1hour chart of BRENT OIL, source: Ultima Markets MT4) 

Key Point: Recent significant volatility is observed on the 1-hour chart, with the ATR combination indicator signaling an effective breakthrough. Traders should exercise caution and monitor entry opportunities.


Pivot Indicator

Pivot Indicator For Brent Oil in Ultima Markets MT4

(1-hour chart of BRENT OIL, source: Ultima Markets MT4) 

Key Point: According to the pivot indicator in Ultima Markets’ MT4 platform, the central price of the day stands at 92.210. Technical outlook:

  • Bullish Scenario: Above 92.210, with targets set at 92.951 and 95.175.
  • Bearish Scenario: Below 92.210, with targets at 90.003 and 89.210.


Legal Documents 

Ultima Markets, a trading name of Ultima Markets Ltd, is authorized and regulated by the Financial Services Commission “FSC” of Mauritius as an Investment Dealer (Full-Service Dealer, excluding Underwriting) (license No. GB 23201593). The registered office address: 2nd Floor, The Catalyst, 40 Silicon Avenue, Ebene Cybercity, 72201, Mauritius. 

Disclaimer

Comments, news, research, analysis, price, and all information contained in the article only serve as general information for readers and do not suggest any advice. Ultima Markets has taken reasonable measures to provide up-to-date information, but cannot guarantee accuracy, and may modify without notice. Ultima Markets will not be responsible for any loss incurred due to the application of the information provided.  

Copyright © 2023 Ultima Markets Ltd. All rights reserved. 

2023 Live Trading Competition  

Live Trading Competition is here!
Be ready to be on top.

We are excited to announce and introduce our first-ever Live Trading Competition!

This is your chance to demonstrate your trading prowess in a real-time trading environment, compete against fellow traders, and win exciting prizes.

Whether you’re a seasoned trader or just starting out, the 2023 Live Trading Competition is designed to provide an exhilarating experience and an opportunity to learn and grow.

Ten participants who adhere to all contest rules and achieve the highest returns (based on the percentage increase in account equity) during the competition period will be declared the top winners and receive the following prizes:

Get yourself ready to conquer and dominate the trading world. Register now to secure your spot in the Live Trading Competition!

If you have any questions or need assistance with registration, please do not hesitate to contact our dedicated support team at [email protected].

Ultima Markets Holiday Trading Hours Adjustment Notice

The trading sessions of some products will be adjusted due to international holidays. Please refer to the following details:
Holiday Date Adjustments (Product / Actions)
National Day 2023.10.02 Market Closed HK50, HK50ft
National Foundation Day 2023.10.03 Market Closed USDKRW
Indigenous People’s Day 2023.10.09 Market Closed USDBRL, USDCLP, USDCOP,
USDTWD, USDKRW
ROC National Day 2023.10.10 Market Closed USDTWD
Our Lady of Aparecida Day 2023.10.12 Market Closed FX / USDBRL,
Indices / BVSPX
Day of the Races 2023.10.16 Market Closed USDCOP
Chung Yeung Festival 2023.10.23 Market Closed HK50, HK50ft
Reformation Day 2023.10.27 Market Closed USDCLP

Important Reminder:

  • • The mentioned times are based on DST system time GMT+3.
  • • Liquidity providers might adjust the trading sessions base on market conditions. The up-to-date execution data should be subject to information on MT4.
    If you have any questions or require assistance, please do not hesitate to contact [email protected]