The Impact of BOE and FED Decisions on the British Pound and Economy
The British pound has seen a remarkable resurgence in recent times, climbing above the $1.23 mark against the US dollar. This is the highest level for the pound since mid-October 2022.
The rise can be attributed to key decisions and outlooks from both the Bank of England (BOE) and the US Federal Reserve.
Factors Driving the Pound’s Rise
Several factors related to the stances of the BOE and Fed have contributed to lifting the pound:
- Fed holds interest rates steady – The Fed’s decision not to raise rates further due to signs of slowing US job growth has boosted confidence in the pound as an investment option compared to the dollar.
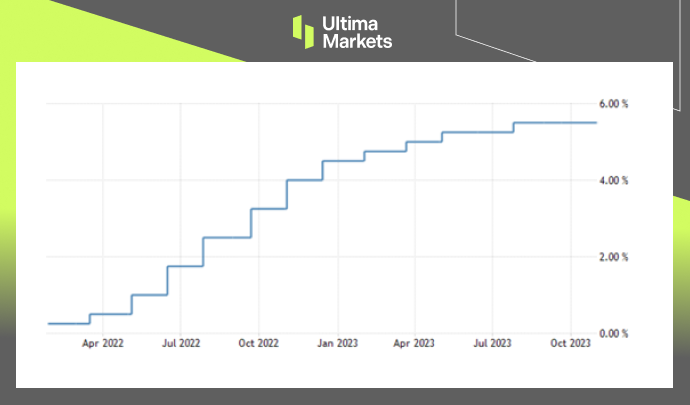
- BOE maintains firm interest rate stance – By holding its key rate at a 15-year high of 5.25%, the BOE has signaled its commitment to stability and shored up faith in the pound.
- Reassurance from Governor Bailey – Comments from BOE Governor Andrew Bailey signaling no near-term rate cuts and upholding guidance on further hikes has reinforced the bank’s position.
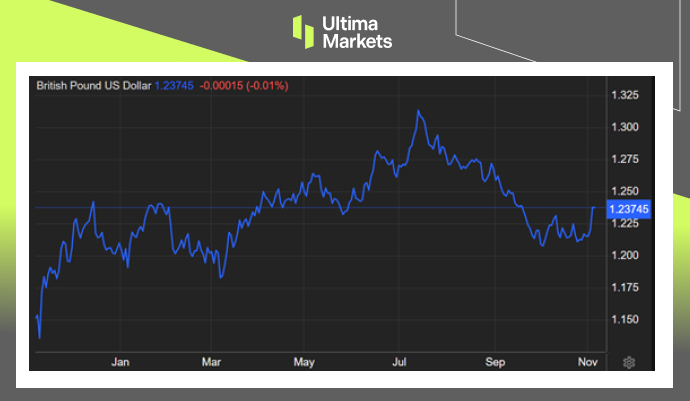
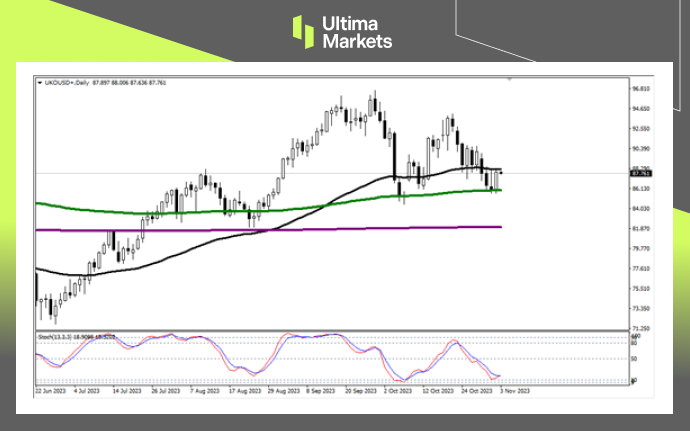
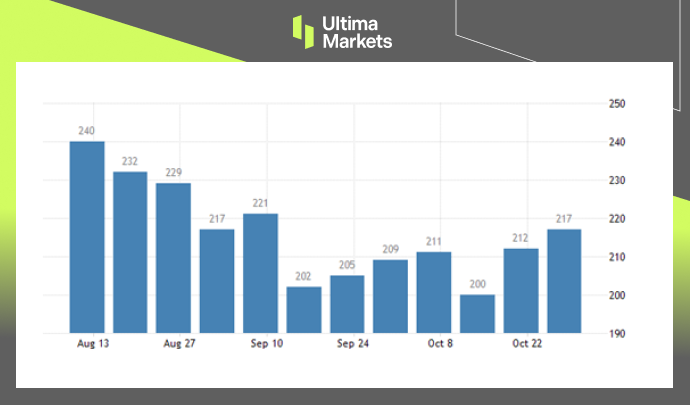
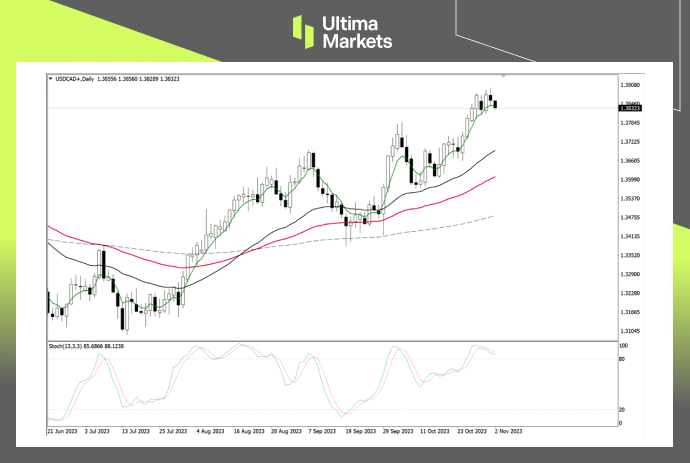
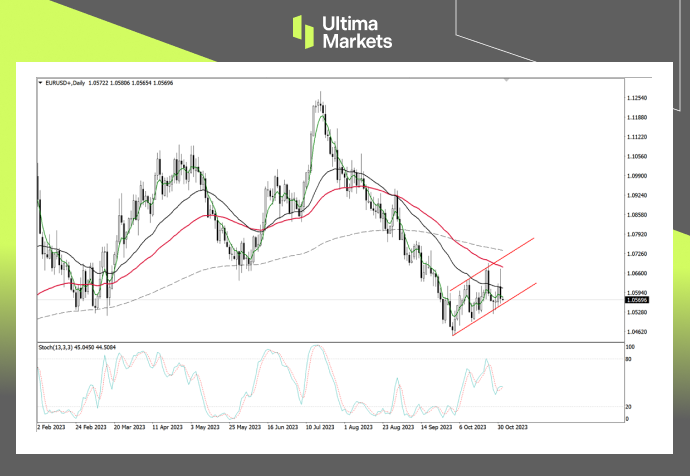
(GBP/USD 1-year Chart)
Bank of England Outlook and Policy
The BOE has provided clarity around its monetary policy outlook and intentions:
- No rate cuts expected soon – Bailey has indicated rate reductions are not on the horizon, offering certainty to markets.
- Potential 3 quarter-point cuts by end 2024 – Markets speculate up to 75 basis points in cuts could come in 2024 as the BOE eyes the weak growth outlook.
- On track to meet inflation target – BOE forecasts show inflation is slated to halve by year-end to meet the 2% target.
- Inflation to remain above target until late 2025 – Projections see inflation at 3.1% in Q4 2024 before declining to 1.9% in Q4 2025, underscoring the bank’s anti-inflation stance.
Bank of England Interest Rate Projections
| Period | Interest Rate Projection |
|---|---|
| Q4 2022 | 5.25% |
| Q4 2023 | 4.50% |
| Q4 2024 | 3.75% |
| Q4 2025 | 3.00% |
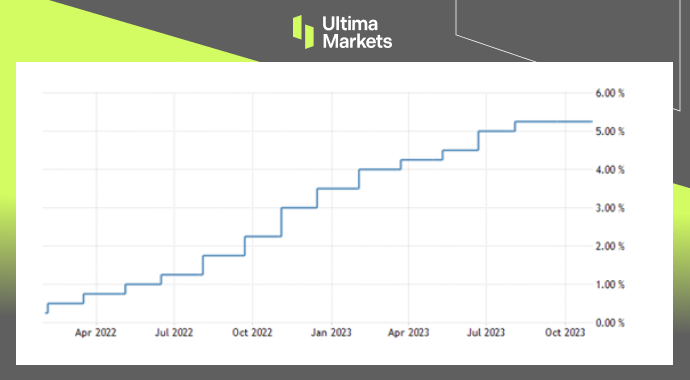
(United Kingdom Interest Rate, BOE)
Economic Headwinds Facing the UK
While positive for the pound, the BOE has cautioned around significant challenges for the UK economy:
- Q3 growth stagnation – Economic expansion stalled in the third quarter of 2022.
- Minimal Q4 growth expected – Forecasts show just 0.1% GDP growth to close out 2022.
- Subdued 2023 growth outlook – The BOE sees the UK economy contracting throughout 2023.
- High energy costs hit output – Expensive energy is forcing firms to cut back production.
- Labor market concerns – Despite low unemployment, weak wage growth and poor productivity weigh on the economy.
- Global slowdown impacts exports – Weaker EU and US markets are dampening demand for UK exports.
Impact on the British Pound
The pound’s rally indicates it remains an attractive safe-haven currency investment despite clouds on the UK’s economic horizon:
- BOE policy credibility supports pound – The central bank’s consistency and transparency in laying out its policy intentions instills market trust in the pound.
- UK rate advantage persists over dollar – The Fed being closer than the BOE to ending its tightening cycle preserves higher yield appeal for sterling.
- Inflation fight remains intact – The BOE’s commitment to getting inflation down reinforces the pound as a stable store of value.
- Economic challenges mainly priced in – Markets have largely priced in the headwinds facing the UK economy, limiting downside for the pound.
Conclusion
In summary, the BOE and Fed’s policy signaling has provided key support for the British pound’s surge above $1.23.
Despite economic struggles ahead, the UK central bank’s firm anti-inflation stance and rate advantage over the dollar are likely to continue underpinning sterling strength.
However, further dollar gains on aggressive Fed tightening or an unanticipated BOE pivot on rates pose risks.
Overall, the pound looks set to remain on solid footing as long as the BOE maintains policy credibility.