This website is managed by Ultima Markets’ international entities, and it’s important to emphasise that they are not subject to regulation by the FCA in the UK. Therefore, you must understand that you will not have the FCA’s protection when investing through this website – for example:
You will not be guaranteed Negative Balance Protection
You will not be protected by FCA’s leverage restrictions
You will not have the right to settle disputes via the Financial Ombudsman Service (FOS)
You will not be protected by Financial Services Compensation Scheme (FSCS)
Any monies deposited will not be afforded the protection required under the FCA Client Assets Sourcebook. The level of protection for your funds will be determined by the regulations of the relevant local regulator.
Note: Ultima Markets is currently developing a dedicated website for UK clients and expects to onboard UK clients under FCA regulations in 2026.
If you would like to proceed and visit this website, you acknowledge and confirm the following:
1.The website is owned by Ultima Markets’ international entities and not by Ultima Markets UK Ltd, which is regulated by the FCA.
2.Ultima Markets Limited, or any of the Ultima Markets international entities, are neither based in the UK nor licensed by the FCA.
3.You are accessing the website at your own initiative and have not been solicited by Ultima Markets Limited in any way.
4.Investing through this website does not grant you the protections provided by the FCA.
5.Should you choose to invest through this website or with any of the international Ultima Markets entities, you will be subject to the rules and regulations of the relevant international regulatory authorities, not the FCA.
Ultima Markets wants to make it clear that we are duly licensed and authorised to offer the services and financial derivative products listed on our website. Individuals accessing this website and registering a trading account do so entirely of their own volition and without prior solicitation.
By confirming your decision to proceed with entering the website, you hereby affirm that this decision was solely initiated by you, and no solicitation has been made by any Ultima Markets entity.
Fundamentally speaking, the US released retail sales in July increased by 0.7% mom. The figure for June was also revised up to 0.3% from 0.2%, suggesting the U.S. economy continued to expand in 3Q and avoid recession. Consequently, inflation stays still in the short run. With demand remaining resilient and labor market tightening, curbing inflation has become a tricky problem for the FED. We believe gold is heading for a bounce.
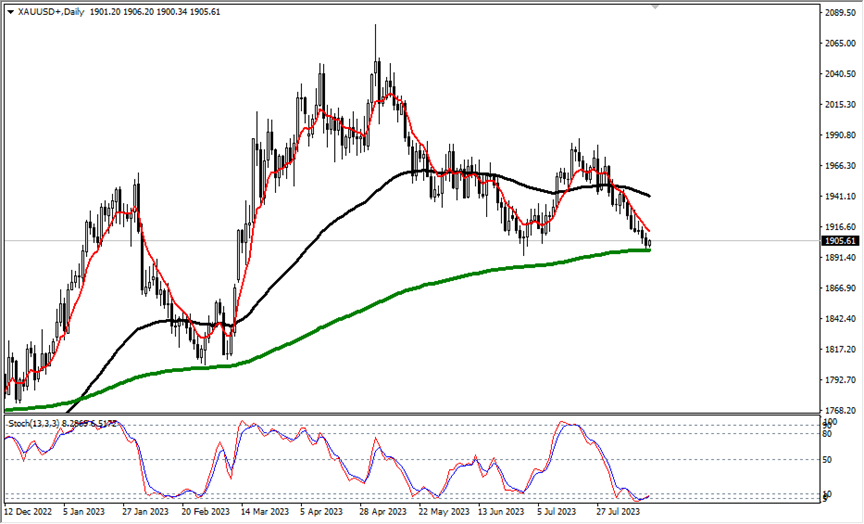
Technically speaking, the gold daily has come to a key support zone – the 240-day moving average .
(Gold daily cycle, Ultima Markets MT4)
The 240-day moving average has been a supportive position for gold since 2022. The gold price made small fluctuations in the supportive zone during the past week, nevertheless, the stochastic oscillator signaled a golden cross yesterday.
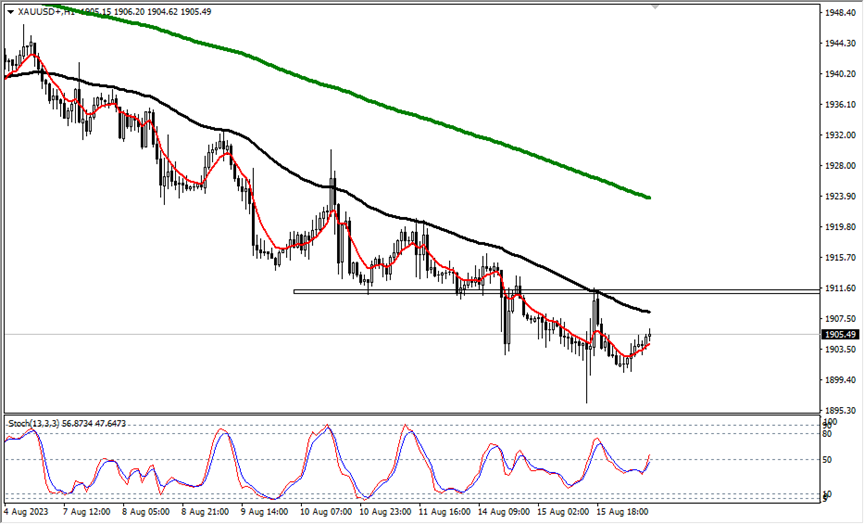
(Gold in 1- hour period, Ultima Markets MT4)
In 1-hour period, the gold price went down again after stepping back on the 65 – period moving average yesterday, but it did not fall below the previous low. Looking at the overall structure, the gold price has a probability of forming a bottom structure. After the price breaks through the previous suppressed position, please make sure if the ATR combination indicator shows an effective breakthrough.
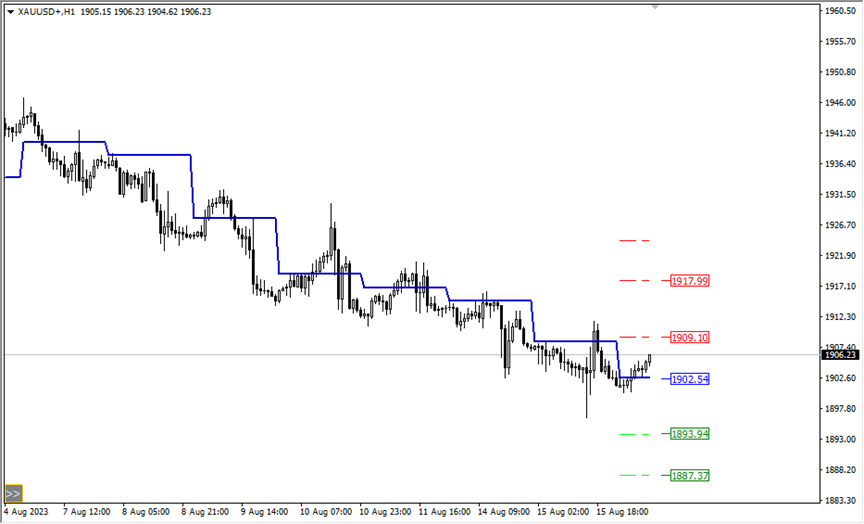
(Gold in 1- hour cycle, Ultima Markets MT4)
According to the pivot indicator in Ultima Markets MT4, the central price is 1902.54,
Bullish above 1902.54, the first target is 1909.10, and the second target 1917.99.
Bearish below 1902.54, the first target is 1893.94, and the second target 1887.37.
Disclaimer Comments, news, research, analysis, price, and all information contained in the article only serve as general information for readers and do not suggest any advice. Ultima Markets has taken reasonable measures to provide up-to-date information, but cannot guarantee accuracy, and may modify without notice. Ultima Markets will not be responsible for any loss incurred due to the application of the information provided.
The specification for US shares CFD will be adjusted during the end of the earnings season.
Adjustment Details
1. Effective Date: Since 21, Aug 2023
2. Adjustment: The leverage of US Shares CFD will be adjusted from 20:1 to “33:1”.
From 21, Aug 2023
Product
Previous Leverage
Leverage after updating
US share CFDs
20:1
33:1
Friendly Reminder
• The margin requirements for the above products will decrease with the leverage adjustment. The margin level may be affected; please pay attention to your trading strategy and account risk.
• Due to the inherent uncertainty in the market, please refer to the MT4 software as the primary source for executing trades and monitoring market conditions.
• The holding positions can be kept after the adjustment.
If you have any questions or require assistance, please do not hesitate to contact [email protected].
3 Basic Concepts in Forex Trading Key to Beginners
Forex trading can be complex for beginner investors if they don’t understand some basic concepts or elements. Except for margin and leverage mentioned in our previous article, “Understanding Margin and Leverage: Why Forex Trading May Boost Your Profits”, we are going to walk through another 3 basic elements key to forex trading in this article.
Pips & Spread
Pips are a way to measure the price movement of currency pairs in the forex market, while spread refers to the difference between the buying price and selling price of a currency pair.
Think of pips as the small units that represent changes in the value of a currency pair. Pips are usually displayed as the last decimal place in the exchange rate. For example, if the exchange rate of the EUR/USD currency pair moves from 1.2000 to 1.2010, it means it has moved 10 pips.
As for the spread, it’s the cost you pay to enter a trade. When you see a currency pair quote, it will show two prices: the higher ask or offer price and the lower bid price. The difference between these two prices is the spread.
Imagine you want to trade the USD/JPY currency pair, and the current quote is 110.50/110.55. In this case:
The bid price is 110.50, which means if you want to sell the currency pair, you will receive 110.50 Japanese yen for every US dollar.
The ask price is 110.55, which means if you want to buy the currency pair, you will have to pay 110.55 Japanese yen for every US dollar.
In this example, the spread is 5 pips, as the difference between the bid price (110.50) and the ask or offer price (110.55) is 5 pips.
Take Profit
Take profit and stop loss are two important tools used in forex trading to manage risk and protect trading positions. Let’s explain take profit first.
Take profit is a predetermined level at which you decide to close a trade and secure your profits. It’s like setting a target for your amount of profit you want to achieve from a trade. When the market reaches your specified take profit level, your trade is automatically closed to realize the profit.
Imagine you bought the EUR/USD currency pair at 1.2010, and you set your take profit at 1.2110. This means you aim to capture a profit of 100 pips. If the market moves up and reaches 1.2110, your trade will be closed automatically, limiting your profit to 100 pips.
Stop Loss
Stop loss is a predetermined level at which you decide to exit a trade to limit your potential losses. It’s like a bottom-line that protects your trades from significant drawdowns. When the market moves against your position and reaches your specified stop loss level, your trade is automatically closed to prevent further losses.
Continuing from the previous example, let’s say you also set a stop loss at 1.2050. This means you are willing to accept a maximum loss of 50 pips. If the market moves down and reaches 1.2050, your trade will be closed automatically, limiting your loss to 50 pips.
By using take profit and stop loss orders, you can manage your risks effectively, protect your investment, and maintain a consistent and disciplined approach to forex trading.
Summary
Pips are a way to measure the price movement of currency pairs in the forex market, while spread refers to the difference between the buying price and selling price of a currency pair.
Take profit is a predetermined level at which you decide to close a trade and secure your profits, resembling a target for your amount of profit you want to achieve from a trade.
Stop loss is a predetermined level at which you decide to exit a trade to limit your potential losses, resembling a bottom-line that protects your trades from significant drawdowns.
Fundamentally speaking, although Fed’s rate hike coming to an end, the U.S. dollar index continues to rise. According to data released by the CFTC last week, the short positions fell to the lowest level in eight weeks. Short-covering is fueling a rebound in the U.S. dollar index as hedge funds continue to trim their short positions.
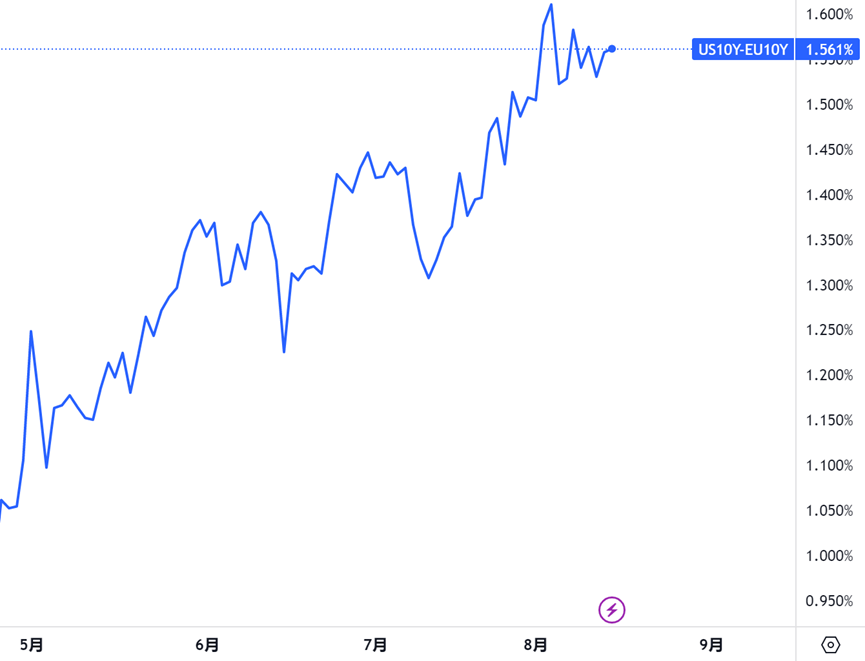
(US 10 -Year Treasury Yield vs EU 10 -Year Treasury Yield)
During the tightening monetary cycle, the spread of long-term bonds between the United States and Europe drives arbitrage funds to buy dollar and sell euro. In the short term, the spread deliveries adjustments to the exchange rate.
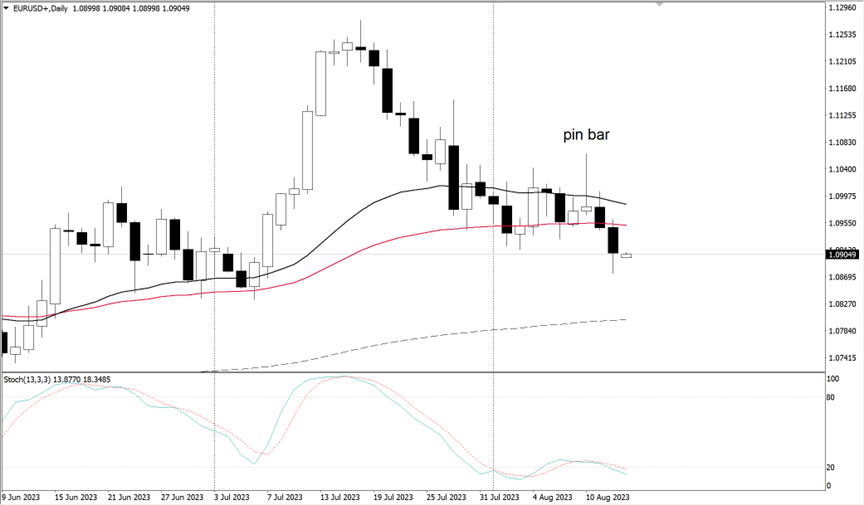
Technically speaking, the EUR/USD daily cycle completed a breakout of last Friday’s low yesterday. The market has a high probability of ushering in a downward trend in the next two days.
(EUR/USD daily cycle, Ultima Markets MT4)
The exchange rate fell below multiple moving averages and was blocked by the 61.8% golden ratio Fibonacci retracement position yesterday. Today there is a certain probability of stepping back on the moving average or consolidating prices, but if today’s market continues to fall below yesterday’s low, the euro will remain weak against the dollar.
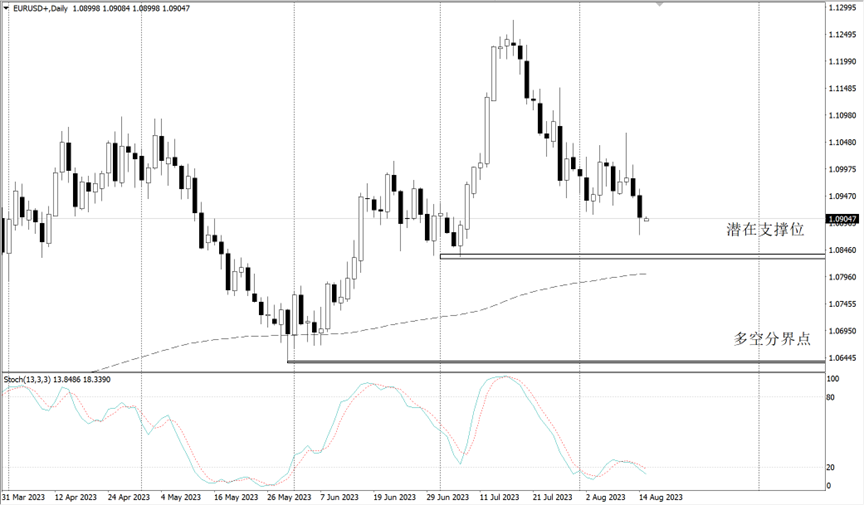
(EUR/USD daily cycle, Ultima Markets MT4 )
From the perspective of daily structure, there are two key support positions below the level, 1.0836 is the potential target, and 1.0639 is the extremely critical long-short boundary. If all supportive levels are crushed, a deep correction will come along.
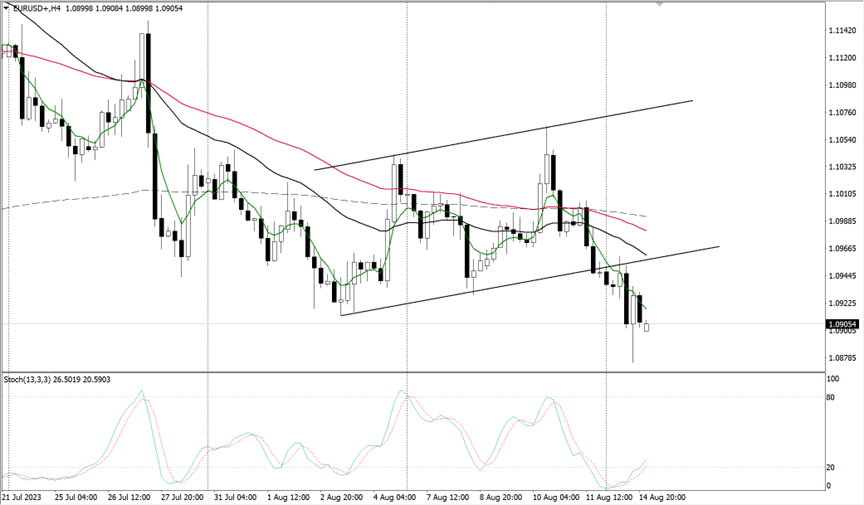
(EUR/USD in 4 -hour cycle, Ultima Markets MT4)
In 4- hour cycle, bull and bear are in entanglement. The Stochastic Oscillator displays a golden cross to indicate the bull, but the exchange rate maintains a downward trend. It means that the decline is not firm enough, and the rebound is still strong.
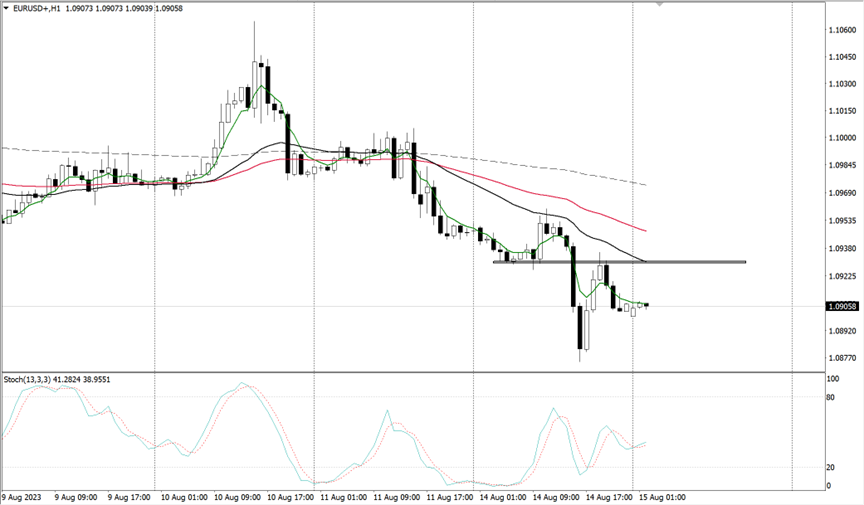
(EUR/USD in 1- hour cycle, Ultima Markets MT4)
In 1- hour cycle, the price still has the probability of stepping back on the moving average and resistance level. If Stochastic Oscillator shows a dead cross later on, please look for short trading opportunities.
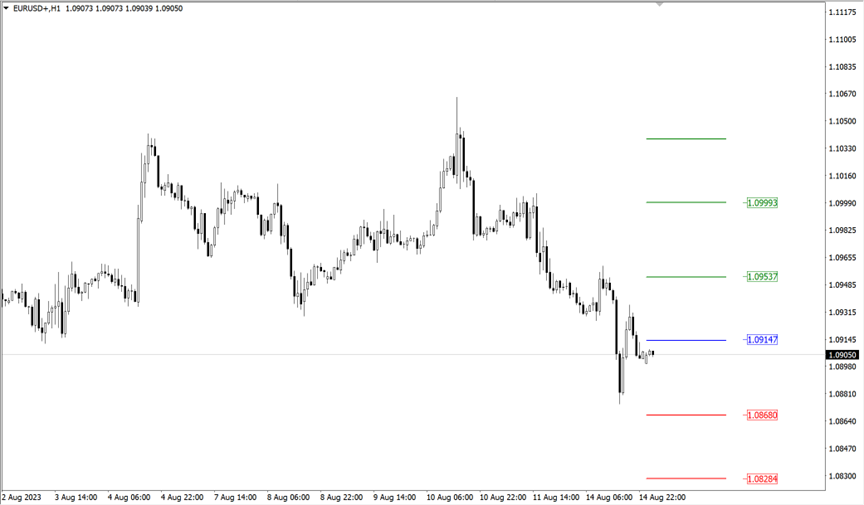
According to the pivot indicator in Ultima Markets MT4, the central price is 1.09147,
Bullish above 1.09147, the first target is 1.09537, and the second target 1.09993.
Bearish below 1.09147, the first target is 1.08680, and the second target 1.08284.
Disclaimer
Comments, news, research, analysis, price, and all information contained in the article only serve as general information for readers and do not suggest any advice. Ultima Markets has taken reasonable measures to provide up-to-date information, but cannot guarantee accuracy, and may modify without notice. Ultima Markets will not be responsible for any loss incurred due to the application of the information provided.
RBNZ might hold rates unchanged while institutions short on NZD
The Federal Reserve Bank of New Zealand will announce the latest interest rate decision on Wednesday, and the market expects to keep the OCR official cash rate unchanged at 5.50%.
At the moment, global economics are cooling, while the figures released by RBNZ are not strong enough.
Consequently, RBNZ gains space to keep interest rates unchanged and time to observe the inflation situation further.
The Intricacies of the New Zealand Economy
NZ economic data displays a mixed picture, with inflation data tapering off despite resilient demand, leaving investors conflicting signals. NZ economic conditions have not weakened as badly as previously expected.
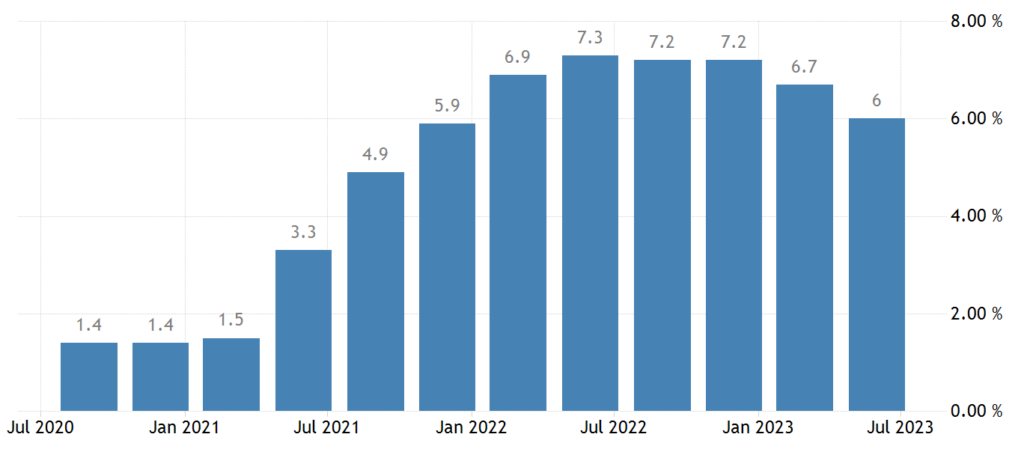
(NZ inflation rates in one year)
Although inflation has started to fall, it has remained high. The strong labor market has prompted RBNZ to postpone an expected rate cut originally scheduled for the fourth quarter of 2023 until the second quarter of 2024.
The wage growth has declined, however, stayed at an elevated level, hampering RBNZ to reach its inflation goal. NZ’s GDP growth rate is expected to pick up slightly in 2023, showing some resilience in its economy.
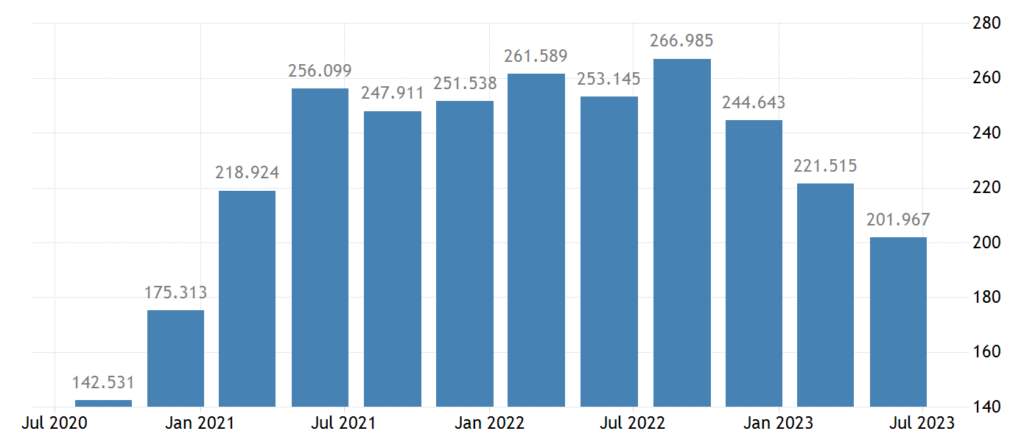
(NZ job vacancies decreased since July 2022)
The Uncertainty Surrounding OCR
A ‘watch, worry, and wait’ stance seems the most likely outcome of the OCR review. However, some institutions believe it is possible to see rates go up to 5.75% in the future. The divergence reflects market uncertainty toward inflation and the economic outlook.
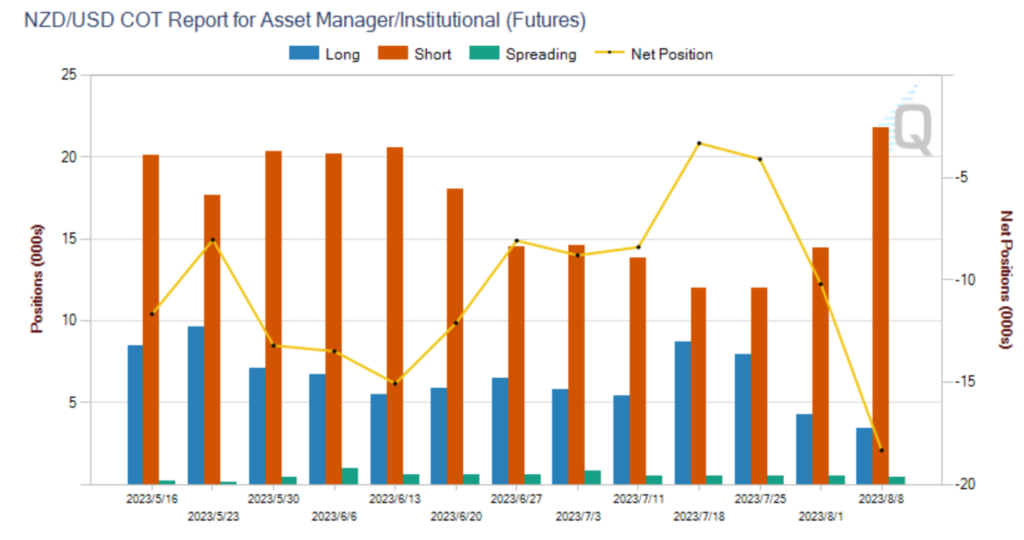
(Institutional short positions increased on NZD/USD)
The positions held by Institutional investors last week showed bearish sentiments on NZD/USD. If RBNZ unexpectedly raises interest rates, NZ’s exchange rate will rise rapidly in the short run.
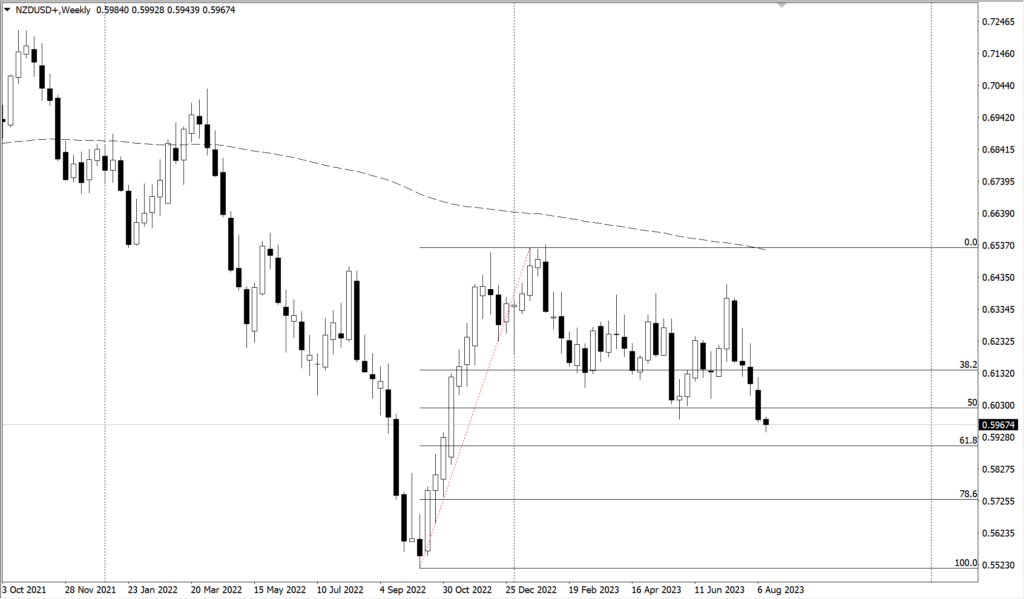
(NZD/USD weekly chart, Ultima Markets MT4)
Institutional Sentiments on NZD/USD
From a technical standpoint, the NZD /USD weekly cycle has fallen into short-term weakness, and the bottom is about to look at the Fibonacci 61.8% retracement position of the upward trend since September 2022.
The Crucial Role of Data and Monetary Policy
In conclusion, the outcome of the RBNZ’s decision hinges significantly on a blend of mixed economic data, inflation trends, and the broader economic outlook.
Investors are well-advised to keep a keen ear out for the central bank’s commentary on inflation and the overall state of the economy during the review.
Furthermore, observing the subsequent market response will provide invaluable insights into the trajectory of New Zealand’s monetary policy.
Disclaimer
Comments, news, research, analysis, price, and all information contained in the article only serve as general information for readers and do not suggest any advice. Ultima Markets has taken reasonable measures to provide up-to-date information, but cannot guarantee accuracy, and may modify without notice. Ultima Markets will not be responsible for any loss incurred due to the application of the information provided.
Last week, the reports released by the three major oil organizations gave investors a better understanding of the short-term crude oil market. After oil prices have been rising for some time, major adjustments are expected this week.
The Dynamics of Demand and Supply
In June 2023, global daily oil demand broke a record at 103 million barrels and is still expected to hit a peak in August.
According to the IEA, demand for crude from the 13 OPEC members averaged 29.8 million barrels per day in the October-December period, much higher than the 27.9 million barrels expected in July.
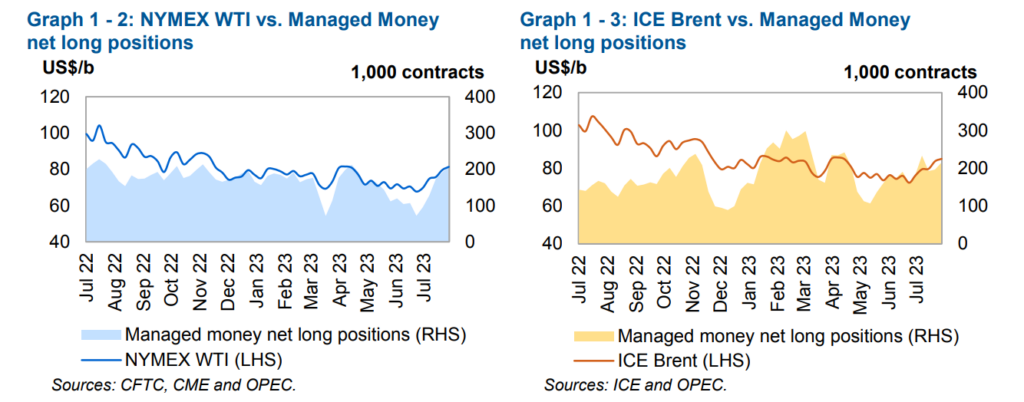
The OPEC monthly report shows that the growth rate of global crude oil demand in 2023 is expected to remain unchanged at 2.44 million barrels per day.
(Net long positions lifting oil prices, OPEC monthly report)
However, global oil supply fell by 910,000 barrels in July, mainly due to Saudi production cuts. Currently, crude oil inventories in developed countries are about 115 million barrels below the five-year average.
That suggests an increasingly tight market, partly due to falling supply. In 2H2023, the IEA forecasts a reduction in global inventories of about 1.7 million barrels per day, suggesting further tensions in the market could result in a bigger impact to prices.
Production Cuts and Their Impact
One of the standout factors contributing to the evolving oil market landscape is the strategic moves made by key oil-producing nations. Saudi Arabia’s unilateral production cuts and Russia’s reduced exports have jointly pushed the output of OPEC+ members to a nearly two-year low. This concerted effort to manage production has played a pivotal role in shaping the current scenario.
Unbalance between supply and demand leading price to swing
Oil prices maintained a steady uptrend in July. From an export standpoint, the export price of Russian crude has risen sharply, with an increase of US$ 8.84 per barrel, and the total price reached US$ 64.410.
Still, Russia’s oil revenues are down by more than a fifth from a year earlier, according to the IEA. However, technically speaking, crude prices will face an adjustment in the short run.
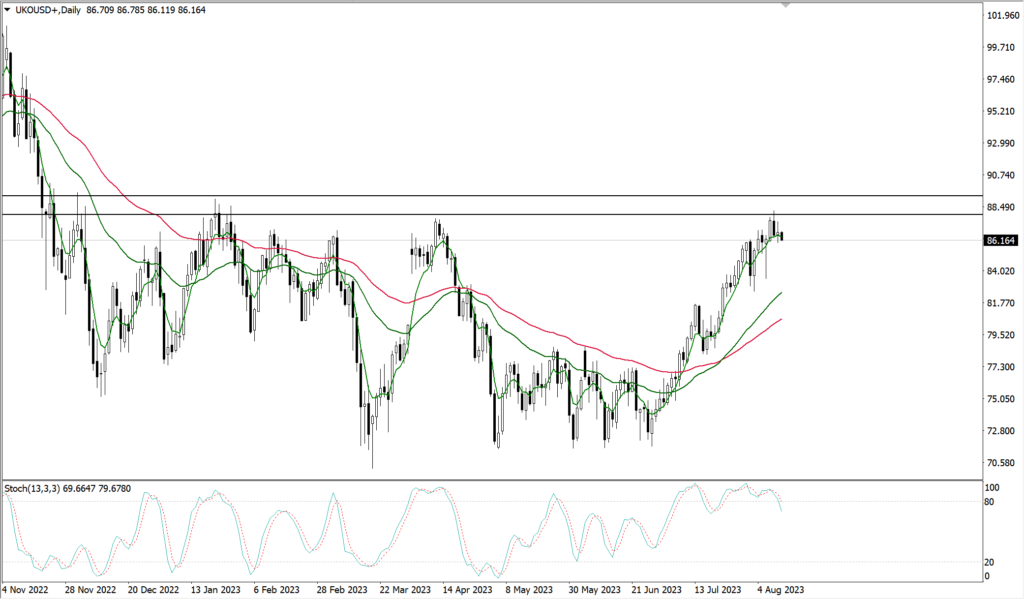
(Daily chart of Brent crude, Ultima Markets MT4)
Based on the daily chart shown above, crude price has reached the important resistance area of 87-88 US dollars. The Stochastic Oscillator is also showing divergence as the price keeps trying to move above this resistance zone.
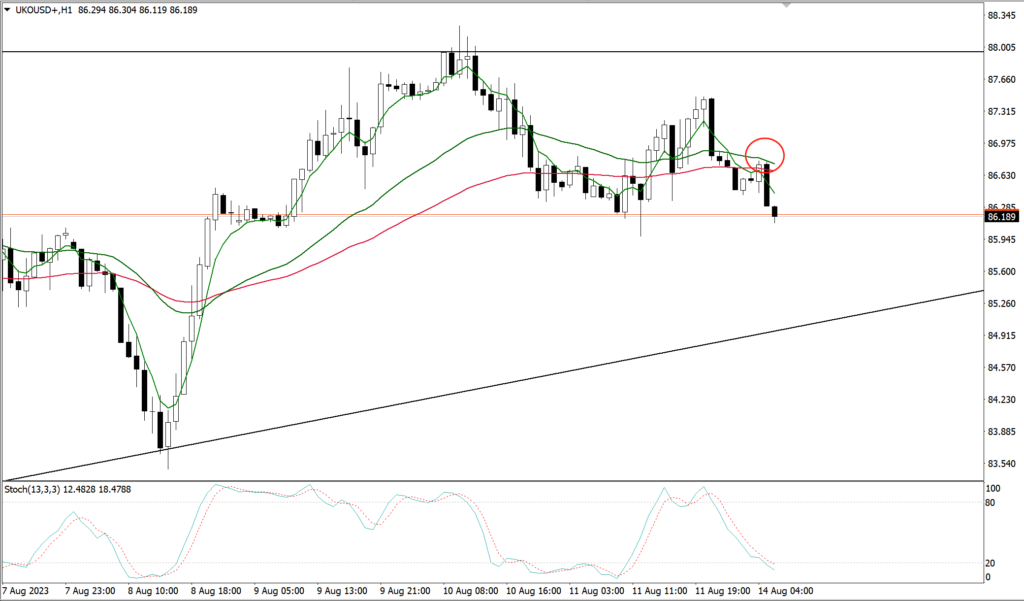
(1- hour chart of Brent crude, Ultima Markets MT4)
In the 1- hour period, the short-term moving average has completely declined, and the medium- and long-term moving average has completely fallen too, and the oil price has also made an effective correction. There is a certain downward pressure on oil prices within the day, and the bottom is looking at the upward trend line.
Overall, oil prices will see some downward pressure in the short run. However, with production cuts and stable demand growth, oil prices still have the momentum to rise this year.
Future Outlook
In conclusion, the oil market is poised to experience short-term downward pressure, influenced by the factors we’ve explored. However, the overarching dynamics, characterized by production cuts and a stable growth in demand, suggest that oil prices still possess the momentum for a potential rise in the year ahead.
It’s important to note that the oil market is susceptible to a multitude of variables and is subject to frequent changes. As an investor or observer, it’s crucial to stay informed about the latest developments and insights to make informed decisions in this ever-evolving market.
Disclaimer
Comments, news, research, analysis, price, and all information contained in the article only serve as general information for readers and do not suggest any advice. Ultima Markets has taken reasonable measures to provide up-to-date information, but cannot guarantee accuracy, and may modify without notice. Ultima Markets will not be responsible for any loss incurred due to the application of the information provided.
On fundamentals, last week PMI figures in the euro zone reconfirmed the pressure on the European economy, with the manufacturing sector recording 42.7 in July, the lowest manufacturing PMI since 2020. The PMI for the services sector was revised down to 50.9 in July, the lowest up to date. In this context, the market’s expectation for the end of the ECB interest rate hike has fallen from the high of 3.95% in July to the current 3.8%. Investors can wait for the market to digest the interest rate difference between Europe and the United States, and then pay attention to the impact of more economic data on the future.
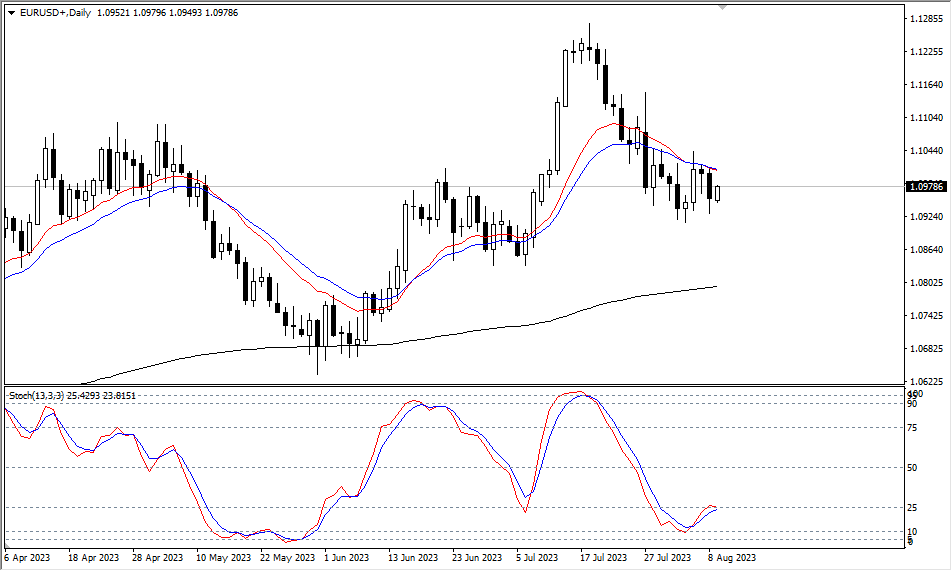
Technically speaking, in EUR/USD daily cycle, the short-term moving averages formed by the 15-day and 21-day suppressed the rise of the exchange rate in the short run. Although it fell below Monday’s low yesterday, there are still bullish opportunities.
(EUR/USD daily cycle, Ultima Markets MT4)
The stochastic oscillator formed a golden cross gesture last week, and there is a bullish potential, but it can only be clarified after the suppression of the short-term moving averages reverses.
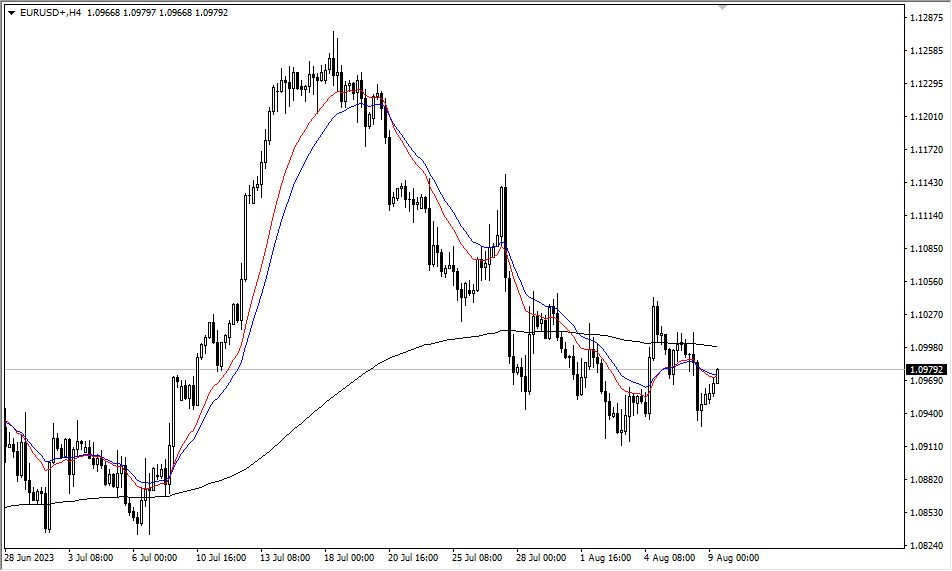
(EUR/USD 4 -hour cycle, Ultima Markets MT4)
In the 4- hour cycle, the exchange rate doesn’t form an effective long structure, and still needs to wait for the confirmation of moving averages and price actions. It is necessary to watch out for any bearish strike in the short term.
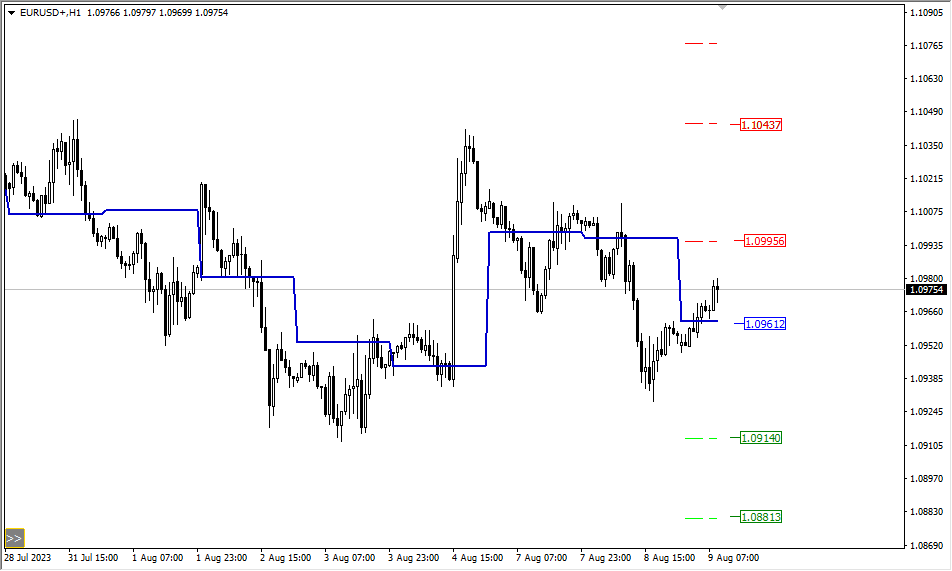
(EUR/USD 1 -hour cycle, Ultima Markets MT4)
According to the pivot indicator, the central price of the day is 1.09612,
Bullish above 1.09612, the first target is 1.09956, and the second target 1.10437.
Bearish below 1.09612, the first target is 1.09140, and the second target 1.08813.
Disclaimer
Comments, news, research, analysis, price, and all information contained in the article only serve as general information for readers and do not suggest any advice. Ultima Markets has taken reasonable measures to provide up-to-date information, but cannot guarantee accuracy, and may modify without notice. Ultima Markets will not be responsible for any loss incurred due to the application of the information provided.
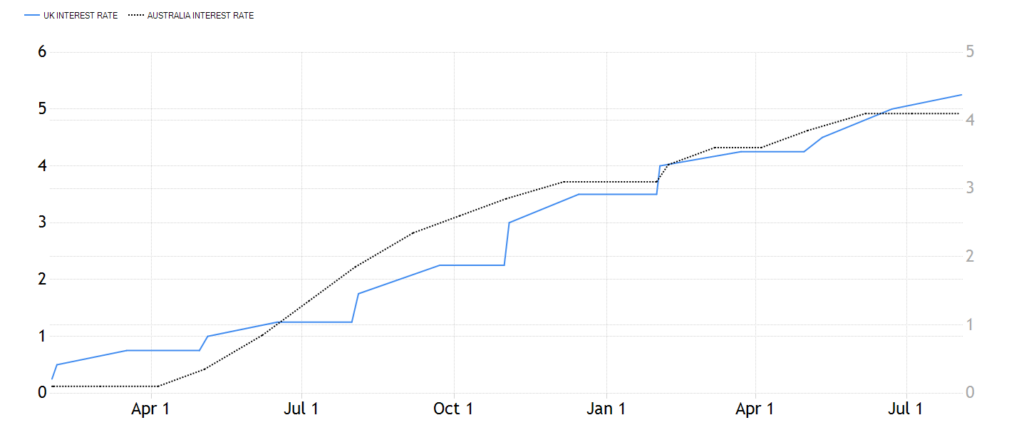
On fundamentals, there is no notable financial data due today. The difference in monetary policy between the UK and Australia will control the currency exchange rate in the short run.
(Blue vs Black, BoE rate vs RBA rate)
The BoE raised its benchmark interest rate by 25 bps to the highest level of 5.25% since 2008. At the same time, the RBA’s is currently set at 4.1%. The interest rate differential means room for arbitrage. AUD is deemed as a commodity currency, inherently vulnerable to commodity prices. The market is positive about RBA rate hikes, resulting in a bullish view of AUD.
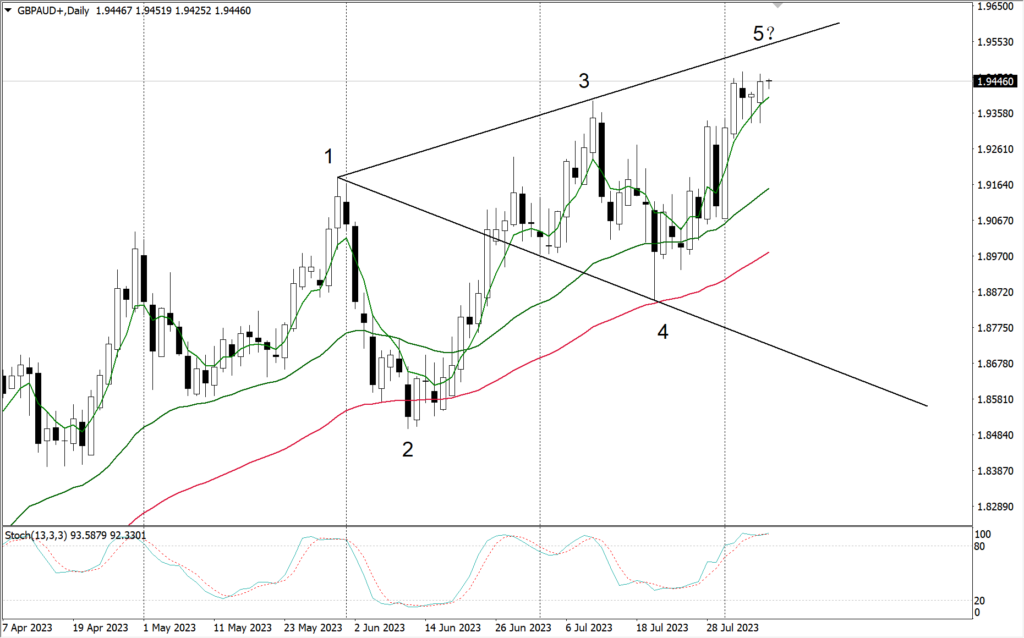
Technically speaking, the GBP/AUD daily cycle structure presents a potential Wolf Wave structure. However, the current price action structure does not show a clear bearish structure.
(GBP/AUD daily cycle, Ultima Markets MT4)
The daily price action has room to rise — support is found on the 33-day moving average. The exchange rate fluctuated on the 5-day moving average for three days and stopped falling with three lower shadows. Still, we need to be alert. The stochastic oscillator has been entangled, and the upper resistance line is not far away. The market may reverse at any time.
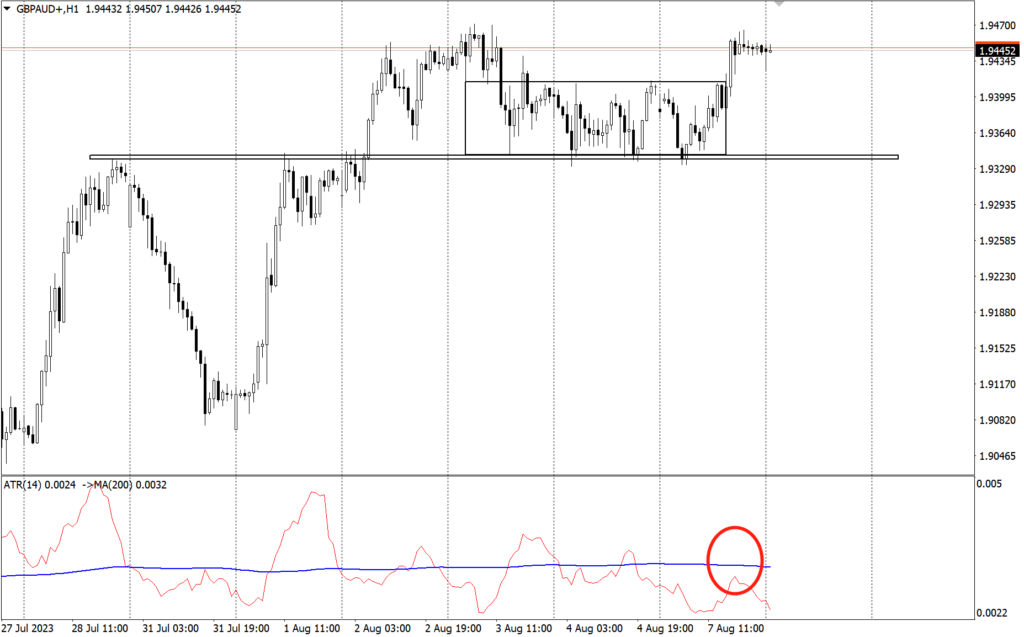
(GBP/AUD 1 -hour cycle, Ultima Markets MT4)
On the hourly chart, GBP/AUD has formed a clear rectangular range after three days of swinging. Yesterday’s breakthrough suggested that bulls are more dominant in the short run. However, judging from the ATR combination indicators, it is doubtful whether the market breakthrough is effective. From a technical standpoint, GBP/AUD looks bullish, however, the sentiment may quickly change.
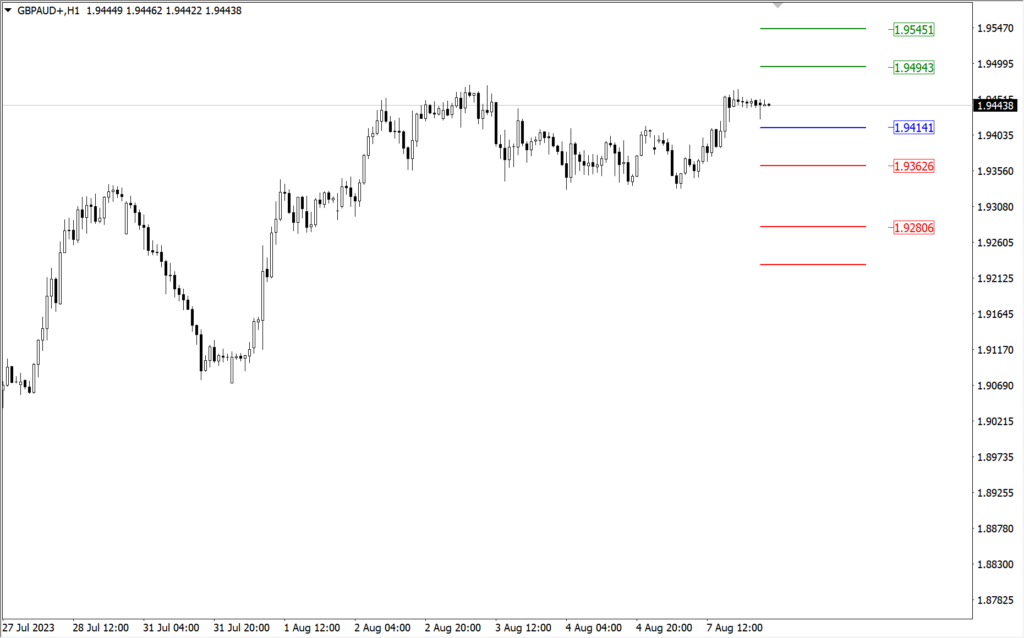
(GBP/AUD 1- hour cycle, Ultima Markets MT4)
According to the pivot indicator in Ultima Markets MT4, the central price of the day is 1.94141,
Bullish above 1.94141, the first target is 1.94943, and the second is 1.95451.
Bearish below 1.94141, the first target is 1.93626, and the second is 1.92806.
Disclaimer
Comments, news, research, analysis, price, and all information contained in the article only serve as general information for readers and do not suggest any advice. Ultima Markets has taken reasonable measures to provide up-to-date information, but cannot guarantee accuracy, and may modify without notice. Ultima Markets will not be responsible for any loss incurred due to the application of the information provided.
Futures contracts switch to new contracts on the expiration date regularly, the process is known as “Rollover.”
Market prices may experience fluctuations caused by non-market factors after the rollover. Positions in futures contracts will undergo corresponding funding adjustments based on the rollover direction to reflect the value change when transitioning between old and new contracts.
Below is the schedule for the futures contract rollover at Ultima Markets in August.
The Rollover Schedule of Futures in Aug
Symbol
Description
Rollover Date
Current Contract
Next Contract
VIX
Volatility
2023/8/11
Aug-23
Sep-23
FRA40ft
France 40 Index Future
2023/8/16
Aug-23
Sep-23
CL-OIL
Crude Oil West Texas Future
2023/8/17
Sep-23
Oct-23
UKOUSDft
Brent Oil Future
2023/8/23
Oct-23
Nov-23
CHINA50ft
CHINA50 Future
2023/8/24
Aug-23
Sep-23
HK50ft
Hong Kong 50 Future
2023/8/25
Aug-23
Sep-23
FLG
UK Long Gilt Futures
2023/8/25
Sep-23
Dec-23
TY
US 10 YR T-Note Futures Decimalised
2023/8/29
Sep-23
Dec-23
Friendly Reminder
• Internal transfers will be suspended during the half-hour before and after the rollover.
• Investors are advised to carefully manage their positions or adjust the take-profit and stop-loss settings before the rollover.
• Liquidity providers might adjust the rollover schedules base on the dynamic nature of market conditions. The up-to-date execution data should be subject to information on the MetaTrader software/application.
If you have any questions or require assistance, please do not hesitate to contact [email protected].
The non-farm payrolls have passed, the inflation data has come, and the dollar is still in decline
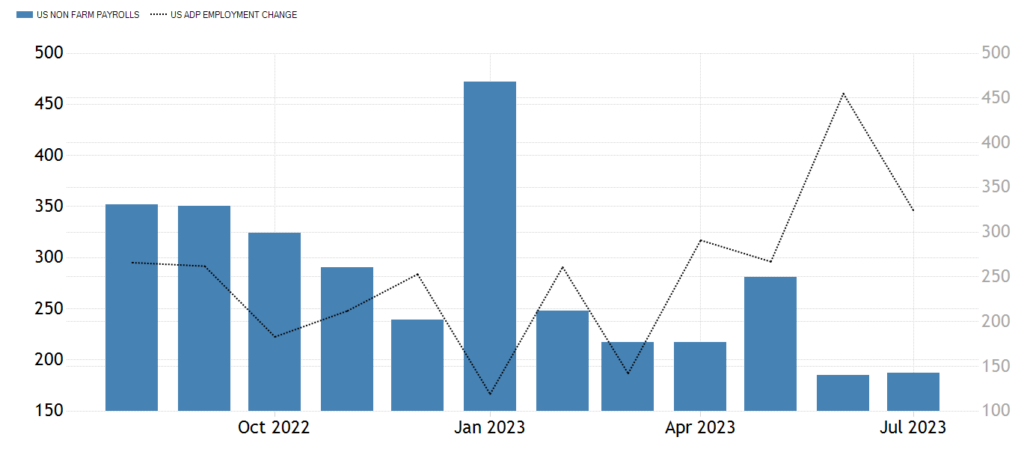
Last Friday, August 4th, the U.S. nonfarm payrolls data fell short of expectations for the second consecutive month. According to the data released by the U.S. Department of Labor, the seasonally adjusted non-agricultural employment in the United States increased by 187,000 in July, the lowest number of new jobs since December 2020, compared with market expectations of 200,000.
Nonfarm Payrolls: A Disappointing Trend
Previously, new job figures for May and June were revised down as well. The May’s number was revised down from 339,000 to 306,000 and the June’s down to 185,000.
It is worth noting that ADP, the identical twin of non-agricultural employment data, also showed a downward trend in August, and this time it did not show the opposite trend to the nonfarm payrolls data.
The divergence in the first two months made the reference value of ADP to decrease.
(Blue column vs black line; non-farm payrolls vs ADP)
Unemployment Rate and Hourly Wages
On the other hand, the unemployment rate eased to 3.5% from 3.6 % in June. In addition, the hourly wage continued to record steady growth in July, increasing by 4.4% year-on-year, beating expectations of 4.2%. The increase in hourly wages may not be what the FED wants to see because of its 2% inflation target.
FED’s Role in the Labor Market
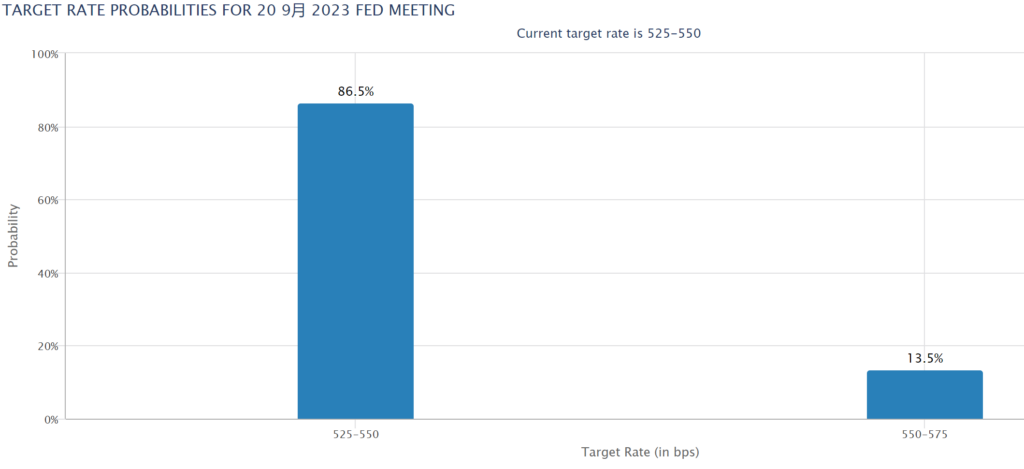
Elon, analyst at Ultima Markets Investment Research Group, said “In general, the FED’s continued tightening policy has begun to take effect in the labor market, and the decline in the number of new jobs for two consecutive months represents the beginning of cooling job market. As a result, the consensus for rate hike in September has not changed significantly.
(The chance that the Fed will not raise interest rates stays at nearly 90%, sourced from the Fed Interest Rate Observation Tool)
Impact on Gold and Non-U.S. Currencies
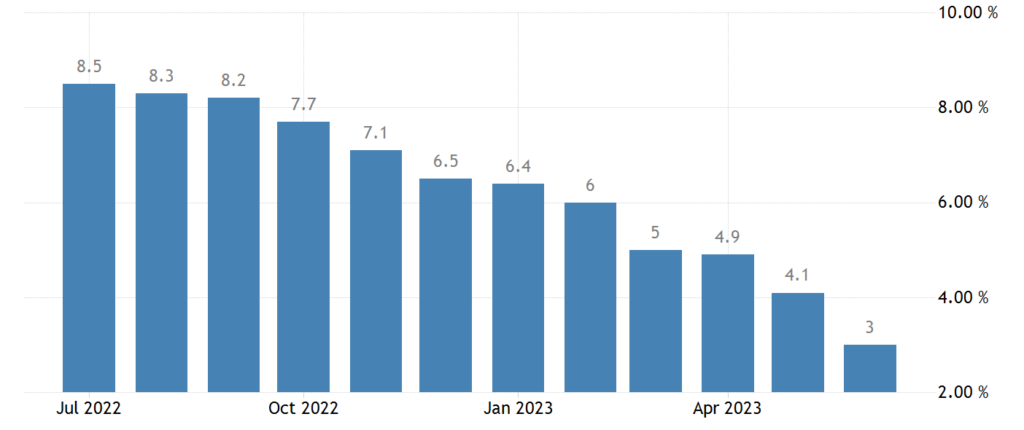
Gold and non-US currencies altogether is happy with the expectation of the Fed’s move to leave interest rates unchanged. It is important to watch out for inflation data this week. Last month, the inflation rate returned to 3%. If the inflation continues cooling, the dollar will go downwards again.
(CPI rates in one year)
Technical Analysis of the Euro
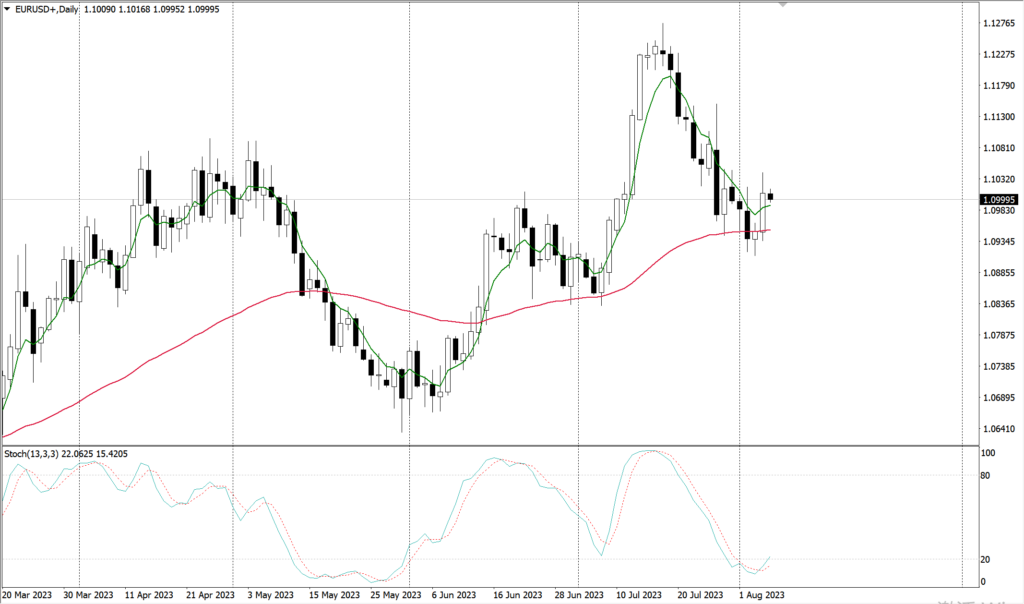
Technically, the euro finds its support on the back of 1.09, rising above the 65-day moving average and the 5-day moving average again. The Stochastic Oscillator is also showing a golden cross gesture, suggesting an underlying bullish trend. If the euro breaks through the peak last week, it will expectedly resume an uptrend.
(Daily chart of EUR/USD, Ultima Markets MT4)
Disclaimer
Comments, news, research, analysis, price, and all information contained in the article only serve as general information for readers and do not suggest any advice. Ultima Markets has taken reasonable measures to provide up-to-date information, but cannot guarantee accuracy, and may modify without notice. Ultima Markets will not be responsible for any loss incurred due to the application of the information provided.