
Is a US Recession in 2023 Likely?
Let’s turn the clock back to the end of last year. At that time, most investors and economists predicted that the US economy would inevitably suffer a recession in 2023 because of the environment of high interest rates.
But today, at the end of July, the Federal Reserve once again raised the federal funds rate by 25 basis points, lifting the target range of the rate to 5.25% to 5.5%, the highest level since 2001.
However, the US economy shows no sign of recession. As of writing, the US NASDAQ, S&P 500 and Dow Jones index went up 39.45%, 16.86% and 6.16% respectively so far this year.
So, will there still be a recession? If there is still the possibility of a recession, when will it happen?
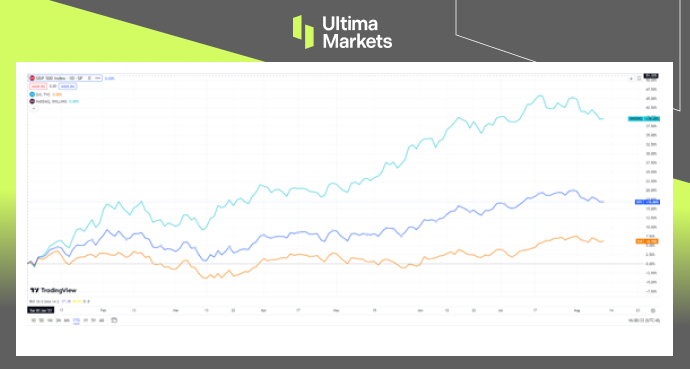
The three major indexes of U. S. stocks are still rising so far this year.
Current situation: the market is still strong
Judging from the current market situation, the US Commerce Department announced on July 27th that GDP in the second quarter of this year grew 2.4% from a year earlier, up from 2% in the first quarter.
At the same time, the Ministry of Commerce said that compared with the first quarter of this year, the higher GDP growth rate in the second quarter reflected a rebound in private sector inventory investment and an increase in non-residential fixed investment. This seems to suggest that the US economy will not experience a hard landing any time soon.
Coincidentally, the US labor market has also shown resilience. The labor department announced on August 4th that the unemployment rate fell to 3.5% in July, down 0.1% from June and nearing a half-century low, while wages rose slightly, with the average hourly wage rising 0.4% in July from a year earlier. The current low unemployment rate also reflects a robust US economy.
Let’s take another look at the inflation data that the Fed is most concerned about. The US Bureau of Labor Statistics reported that the consumer price index (CPI) rose 3.2% in July from a year earlier, up slightly from 3% in June, reflecting rising food prices and still high housing costs.
But beyond that, the rest of the inflation-related data was mostly good news, especially the core CPI data, which excludes food and energy items, slowed further from a year earlier, from 4.8% in June to 4.7% in July. Although inflation has not been suppressed yet, the overall situation has improved significantly than before.
In short, there is a lot of data showing that market vitality is still strong, and it seems that the risk of recession is getting farther and farther away.
Looking back on history: the Truth behind high interest rates
Although the US economy is not showing obvious signs of recession at the moment, is this enough to indicate that recession fears are not enough to worry about? As the saying goes, there is nothing new under the sun. If we look back on history, it is not difficult to find that this may not be the time to rest easy.
In February 2008, it was only months before the collapse of 158-year-old Lehman Brothers. But Ben Bernanke, then chairman of the Federal Reserve, said that while the economic situation was not optimistic, he did not think the US economy would be at risk of recession. And at that time, there were not a few economists who supported this view.
When it comes to the financial crash that swept the global economy in 2008, this crisis actually did not appear at the peak of the high interest rate environment. Contrary to most people’s stereotype, the “Lehman moment” came after the Fed had cut interest rates sharply in a row.
In order to cool the apparently overheated housing market at that time, the Federal Reserve raised the federal funds rate to a high of 5.25% on June 29, 2006, and maintained it for more than a year.
It was not until September 18, 2007, that interest rates were cut by 50 basis points. By the time Lehman collapsed in September 2008, the federal funds rate had already fallen to 2%, entering a low-interest environment.
So, here comes the question, why is the recession still breaking out when interest rates have fallen and the pressure for high interest rates is gone? To answer this question, we need to quote an economic concept here: real interest rate.
The so-called real interest rate refers to the real interest rate level shown by the nominal interest rate after excluding the impact of inflation. If it is expressed in a mathematical formula, it is:
Real interest rate = Nominal interest rate – Inflation rate
Understanding the concept of real interest rates will be of great significance for us to analyze the truth behind high interest rates in the United States! Because corporate borrowing is a normal phenomenon in economic activity. Since borrowing is involved, interest rates are naturally an unavoidable topic. Only at favorable interest rates can the economy get a corresponding boost.
Let’s give a few simple examples here. It is a well-known fact that the inflation rate in the United States remained high last year. Let’s assume that at some point last year, inflation rate was as high as 8%, while the nominal interest rate in the United States was 4%. The high interest rate level of 4% seems to put a lot of pressure on corporate borrowing. However, once we introduce the concept of real interest rate, we will find that the interest rate level of 4% interest rate will not cause any pressure.
Because 4% (nominal interest rate) minus 8% (inflation rate), you get a real interest rate of -4%. At this time, the real interest rate is simply negative. In other words, although enterprises bear the cost of interest rates of 4%, due to the existence of 8% inflation, the prices of products or services produced by enterprises will naturally be pushed up by 8% by inflation.
As a result, enterprises can still make a profit of 4% just from borrowing. Therefore, as long as the real interest rate is negative, simply high nominal interest rates will not necessarily have a recession impact on the economy, because the cost of debt is negative. This is the reason why U. S. stocks still rise all the way in a high interest rate environment.
But let’s give another example. What if nominal interest rates go up all the way and inflation rate starts to fall? For example, suppose the nominal interest rate rises to 5%, while inflation falls to 3%. In this case, the real interest rate becomes +2%, and the previously negative cost of debt has been completely turned into a positive number. And this is what is happening to the US economy right now.
So, what kind of pressure will happen to the economy once real interest rates are negative? With regard to this question, we only need to look back at the past history and the answer is clear at a glance.
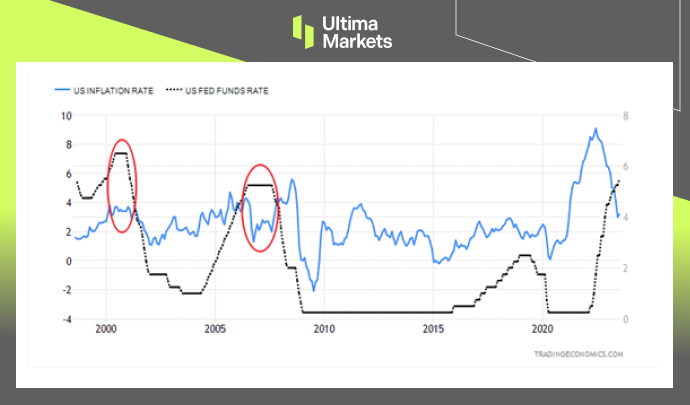
The trend of US inflation and the federal funds rate over the past 25 years.
The blue line: the US inflation rate; the black line: the federal funds rate (or the nominal interest rate).
By looking at the chart above, we can clearly see that in the past 25 years, there are two time periods when the nominal interest rate is higher than the inflation rate, or namely the real interest rate is positive. These two time periods correspond to the two red circles in the above chart.
These two periods roughly correspond to the dotcom crisis in the United States in 2000-01 and the global financial crisis in 2007-08. Thus, when the cost of debt is negative, economic activities tend to develop smoothly, and once the cost of debt is positive, crises often follow.
Outlook: the hidden danger of recession has not been eliminated
Bloomberg conducted a poll among economists last December when 70% of economists thought the US economy would suffer a recession within the next 12 months. But by July this year, that number had fallen to 58%.
Similar surveys are common in many mainstream financial institutions. Goldman Sachs, which thought there was no recession in the US economy as early as last year, further lowered the probability of a recession in the next 12 months to just 20% in July.
It seems that the risk of recession has once again been forgotten by economists. But through the above analysis of real interest rates and a review of history, we can see that the hidden dangers of the current recession have not been completely eliminated.
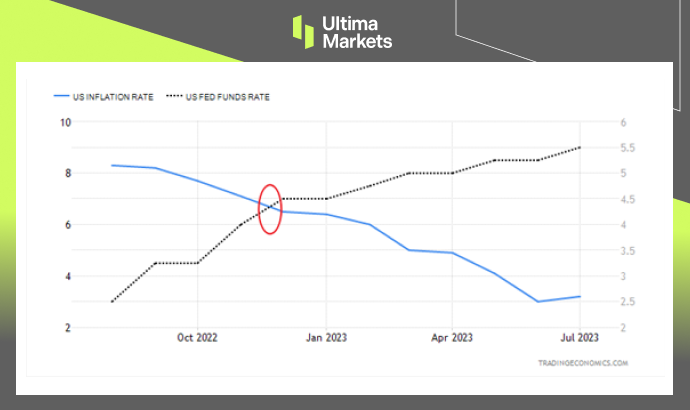
The trend of US inflation and the federal funds rate over the past year.
The blue line: the US inflation rate; the black line: the US federal funds rate (or the nominal interest rate).
The chart above reflects the trend of US inflation and the federal funds rate over the past year. The red circle in the picture reflects that real interest rates have reached a turning point from negative to positive at the end of last year and the beginning of this year.
Of course, the real interest rate can only be regarded as a temporary transition from negative to positive. But it is not clear whether this situation will last for a long time in the future. If the Fed adjusts its interest rate policy in time, or if inflation rises repeatedly, real interest rates are still likely to return to negative territory. In short, real interest rates already pose a potential danger to the possible risk of recession.
Just as real interest rates in the US showed signs of turning from negative to positive, in August, Fitch Ratings, one of the world’s three largest rating agencies, suddenly downgraded the US credit rating, downgrading its long-term rating from “AAA” to “AA+”. For the downgrade, Fitch said it was mainly due to several key drivers:
- 1.The level of governance in the United States has deteriorated:
Federal debt has remained high for years, and repeated debt-limit political standoffs and last-minute resolutions have eroded confidence in fiscal management. All these show that the level of governance in the United States has deteriorated, and public confidence in the government’s financial management has also been undermined.
- 2.Rising government deficits:
Fitch expected the general government deficit to rise to 6.3% of GDP in 2023, from 3.7% in 2022, reflecting cyclically weaker federal revenues, new spending initiatives and a higher interest burden. Additionally, state and local governments were expected to run an overall deficit of 0.6% of GDP this year after running a small surplus of 0.2% of GDP in 2022.
Fitch also forecasted a government deficit of 6.6% of GDP in 2024 and a further widening to 6.9% of GDP in 2025. The larger deficits will be driven by weak 2024 GDP growth, a higher interest burden and wider state and local government deficits of 1.2% of GDP in 2024-2025.
- 3.General government debt to climb:
Fitch predicted that US general government debt as a share of GDP will continue to climb, reaching 118.4% in 2025. That is more than 2.5 times higher than the median of 39.3% for “AAA” and 44.7% for “AA” sovereign countries. Fitch’s long-term forecasts show that the debt-to-GDP ratio will rise further, which will increase the vulnerability of US finances to future economic shocks.
Summary
It is worth mentioning that the fattest brown bears usually exist in the autumn before hibernation, and when winter goes to spring, brown bears are instead the weakest.
It is as if before the recession, countries often had plenty of tools in their fiscal toolboxes, which needed to be consumed in order to deal with risks. If there is a day when there are few fiscal instruments left, leaving the Fed with no choice but to slash interest rates, a recession will then be inevitable.
Therefore, in the future, the market should no longer pay more attention to whether the Fed will continue to raise interest rates, but instead focus on what attitude or way the Fed will use to create the expectation of interest rate cuts in the future. This will deserve further attention from the market in the future.