This website is managed by Ultima Markets’ international entities, and it’s important to emphasise that they are not subject to regulation by the FCA in the UK. Therefore, you must understand that you will not have the FCA’s protection when investing through this website – for example:
You will not be guaranteed Negative Balance Protection
You will not be protected by FCA’s leverage restrictions
You will not have the right to settle disputes via the Financial Ombudsman Service (FOS)
You will not be protected by Financial Services Compensation Scheme (FSCS)
Any monies deposited will not be afforded the protection required under the FCA Client Assets Sourcebook. The level of protection for your funds will be determined by the regulations of the relevant local regulator.
Note: Ultima Markets is currently developing a dedicated website for UK clients and expects to onboard UK clients under FCA regulations in 2026.
If you would like to proceed and visit this website, you acknowledge and confirm the following:
1.The website is owned by Ultima Markets’ international entities and not by Ultima Markets UK Ltd, which is regulated by the FCA.
2.Ultima Markets Limited, or any of the Ultima Markets international entities, are neither based in the UK nor licensed by the FCA.
3.You are accessing the website at your own initiative and have not been solicited by Ultima Markets Limited in any way.
4.Investing through this website does not grant you the protections provided by the FCA.
5.Should you choose to invest through this website or with any of the international Ultima Markets entities, you will be subject to the rules and regulations of the relevant international regulatory authorities, not the FCA.
Ultima Markets wants to make it clear that we are duly licensed and authorised to offer the services and financial derivative products listed on our website. Individuals accessing this website and registering a trading account do so entirely of their own volition and without prior solicitation.
By confirming your decision to proceed with entering the website, you hereby affirm that this decision was solely initiated by you, and no solicitation has been made by any Ultima Markets entity.
The trading sessions of some products will be adjusted due to international holidays.
Please refer to the following details:
Holiday
Date
Adjustment Actions GMT+3
Adjustment Products
Swiss National Day
2025.08.01
Market Closed
SWI20
Battle of Boyacá Day
2025.08.07
Market Closed
USDCOP
Independence Day
2025.08.15
Market Closed
USDINR, IND50, USDCLP, USDKRW
Assumption of Mary
2025.08.18
Market Closed
USDCOP
UK Bank Holiday
2025.08.25
Market Closed
UK100, UK100ft. LongGilt
Late Open 14:30
Cocoa, Coffee, Sugar
UK Bank Holiday
2025.08.26
Late Open 03:00
UK100. UK100ft
Ganesh Chaturthi
2025.08.27
Market Closed
USDINR
Friendly Reminder
• The mentioned times are based on DST system time GMT+3.
• Liquidity providers might adjust the trading sessions base on the dynamic nature of market
conditions. The up-to-date execution data should be subject to information on the MetaTrader
software/application.
If you have any questions or require assistance, please do not hesitate to contact [email protected]
To ensure a more stable trading environment during major news events, Ultima Markets will implement the following temporary leverage adjustments during specific news releases, effective from June 23, 2025:
USD-Related News:
– Leverage for Forex, Gold & Silver, and Indices will be adjusted to 200:1.
– Oil leverage will remain unchanged.
Crude Oil-Related News:
– Leverage for Oil will be adjusted to 200:1.
News Related to Other Countries:
– Leverage for Forex pairs will be adjusted to 200:1.
Please be reminded that:
– Gold and indices will only be affected by USD-related news
– Market volatility risks still exist. We strongly advise maintaining prudent risk management, including appropriate position sizing.
We are committed to providing a secure and efficient trading experience.
Should you have any questions or require further assistance, please do not hesitate to contact our support team.
Thank you for your trust and support in Ultima Markets.
As part of our ongoing commitment to enhancing your trading experience and ensuring a seamless environment for all our clients, we would like to inform you about an upcoming adjustment related to your USC (Cent Account) on the MT4 platform, effective May 17, 2025.
Adjustment Details:
1. USC (Cent) Account History Order Archiving:
Closed position records older than 14 days will be archived.
Open positions, balance, and credit records will not be affected and will remain fully visible.
2. Platform: This adjustment will take effect directly on the MT4 platform.
Friendly Reminders:
1. Irreversible Archiving: Once history position records are archived, they cannot be restored.
2. Orders meeting the auto-archiving conditions will be archived automatically without prior notice.
3. Export Your Records: We strongly encourage you to export your account statement from MT4 in advance to retain any records for your reference. Please click Here for step-by-step guidance on how to export your account statement.
4. This update applies only to historical orders — all active accounts and trading operations will continue as usual.
This adjustment is part of our ongoing efforts to maintain a high standard of service and provide a smooth, efficient trading experience for all our clients.
As part of our commitment to providing our clients with the best reliability and service, there will be a server upgrade & maintenance this weekend.
Trading sessions this weekend are as follows:
Date
Trading sessions
Trade status
Maintenance sessions
2025/03/08 (Sat.)
02:00-23:59 (GMT+2)
Normal
/
2025/03/09 (Sun.)
00:00-07:00 (GMT+2) 15:00-23:59 (GMT+3)
Break
07:00 GMT+2 – 15:00 GMT+3
Friendly Reminder
• During the upgrade process, the client portal and UM App will be temporarily unavailable. Our official website will remain available, but clients will not be able to sign up.
• Any client portal and UM App functions that contain account data adjustments might be temporarily unavailable.
• During the upgrade process, the features of MetaTrader software & application, including but not limited to logging in, quoting and opening/closing positions, will be temporarily unavailable.
• There might be a gap between the original price and the price after maintenance. The gap between Pending Orders, Stop Loss and Take Profit will be filled at the market price once the maintenance is completed.
• Please refer to MT4 for the latest update on the completion and market opening time.
If you have any questions or require assistance, please do not hesitate to contact [email protected].
In this comprehensive analysis, Ultima Markets brings you an insightful breakdown of the USDJPY for 14th November 2023.
Key Takeaways
The widening interest rate gap is the fundamental factor: On October 31, the Bank of Japan further relaxed its control on government bond yields, while the Federal Reserve still has the possibility of raising interest rates. The policy interest rate gap between the two continues to widen, causing the Japanese yen to fall into a continued depreciation trend.
Carry trade is a booster: The interest rate differential between the two countries and the recent continued low volatility of the yen also encourage carry trade. It is a strategy of selling low-interest Japanese yen funds in exchange for high-yielding currencies. This is a contributing factor that keeps the yen under pressure.
The Japanese yen unexpectedly surged: The Japanese yen unexpectedly surged during the U.S. trading session yesterday, which once made the market think that the Bank of Japan had intervened. However, according to the current news, it may be an appreciation fluctuation caused by the adjustment of Japanese yen options positions. Previously, when asked whether he was prepared to intervene in the foreign exchange market or take other measures to curb the yen’s decline, Japan’s top monetary official Masato Kanda said that the authorities “are on standby.”
Frightened Japanese Yen: If the U.S. economic data released this week is good, the Fed’s suspense about raising interest rates will remain. This could push USD/JPY towards the 152 range. However, the continued depreciation of the yen will make the market continue to be wary of the intervention of the Bank of Japan. Once there are signs of appreciation of the yen, the withdrawal of profit-making positions and traders preparing to go long yen on the sidelines will cause the dollar to experience a rapid downward trend against the yen.
Technical Analysis
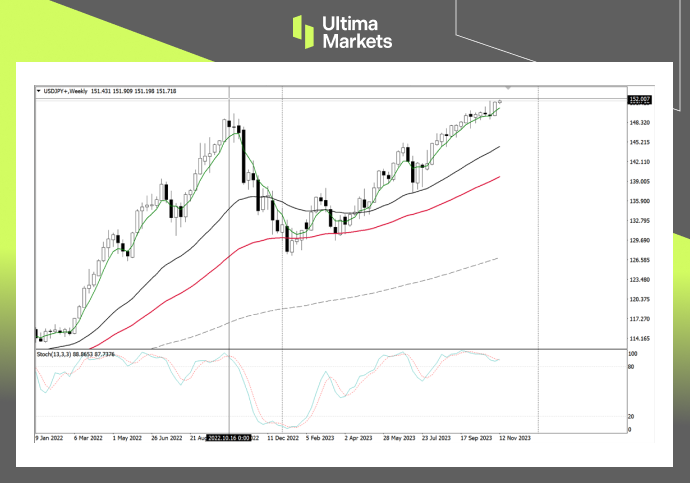
Weekly Chart Insights
Stochastic Oscillator: The indicator has entered the oversold range, and the selling pressure is serious. You need to be alert to the coming of a short-term intraday rebound in the market.
Moving average: After the 5-day moving average completely fell below the 200-day moving average, the market did not show an effective rebound structure, and the two consecutive days of decline may take some time to correct. The rebound target price is looking towards the 5-day moving average.
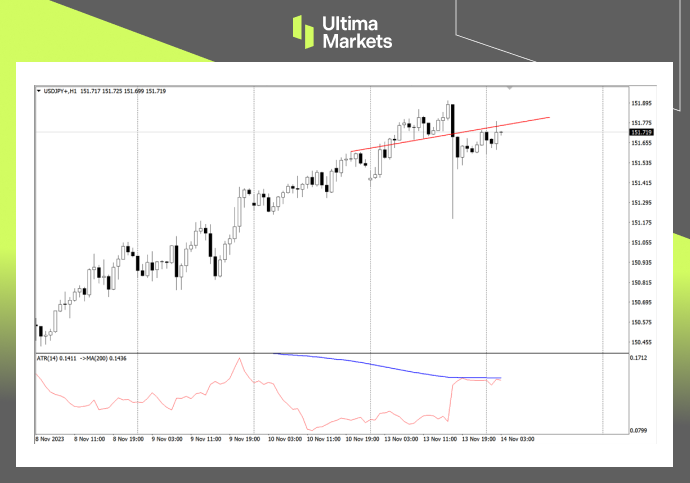
1-hour Chart Analysis
Stochastic oscillator: The indicator has sent a long signal, and oil prices have a certain rebound momentum. However, oil prices cannot rebound lightly until they break through the 81.316 level.
Price Action: Oil prices are currently in a strong downward trend, and you cannot arbitrarily choose to enter the market at the bottom. Although the current indicators are suggesting that a rebound is imminent, we need to wait for a clear bullish structure before making a correction.
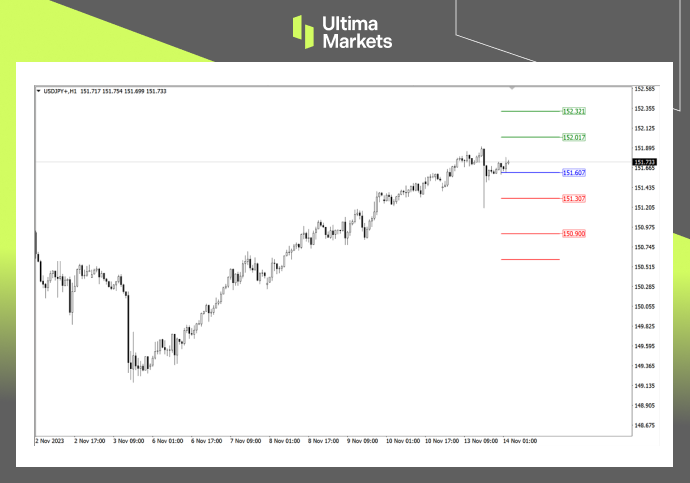
Pivot Indicator
According to the pivot indicator in Ultima Markets MT4, the central price of the day is established at 81.178,
Bullish Scenario: Bullish sentiment prevails above 81.178, first target 82.268, second target 83.852;
Bearish Outlook: In a bearish scenario below 81.178, first target 79.594, second target 78.519.
Conclusion
To navigate the complex world of trading successfully, it’s imperative to stay informed and make data-driven decisions. Ultima Markets remains dedicated to providing you with valuable insights to empower your financial journey.
For personalized guidance tailored to your specific financial situation, please do not hesitate to contact Ultima Markets.
Join Ultima Markets today and access a comprehensive trading ecosystem equipped with the tools and knowledge needed to thrive in the financial markets.
Stay tuned for more updates and analyses from our team of experts at Ultima Markets.
—–
Legal Documents
Ultima Markets, a trading name of Ultima Markets Ltd, is authorized and regulated by the Financial Services Commission “FSC” of Mauritius as an Investment Dealer (Full-Service Dealer, excluding Underwriting) (license No. GB 23201593). The registered office address: 2nd Floor, The Catalyst, 40 Silicon Avenue, Ebene Cybercity, 72201, Mauritius.
Comments, news, research, analysis, price, and all information contained in the article only serve as general information for readers and do not suggest any advice. Ultima Markets has taken reasonable measures to provide up-to-date information, but cannot guarantee accuracy, and may modify without notice. Ultima Markets will not be responsible for any loss incurred due to the application of the information provided.
Written on November 14, 2023 at 11:14 am, by mervin
Comments Off on Focus on USDJPY today – 14th November 2023
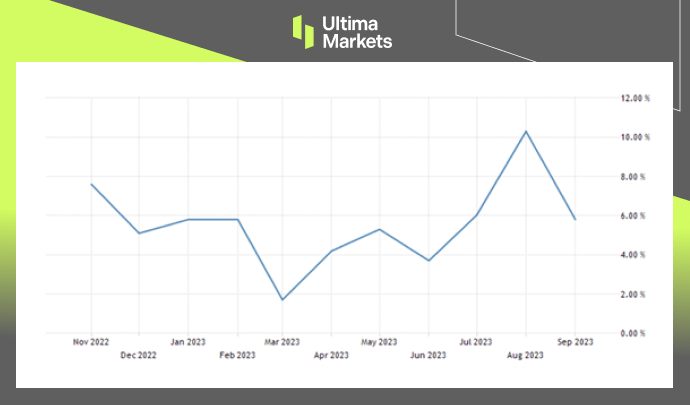
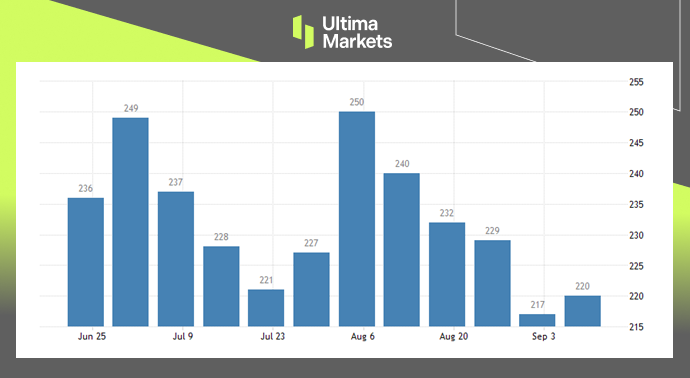
Industrial Growth in India Decelerated to 5.8% in September, Marking a Three-Month Low Compared to 10.3% in August
In the realm of economic fluctuations, India stands as a significant player, showcasing its industrial prowess amidst a landscape shaped by various factors.
Recent statistical revelations have illuminated the nuances of the country’s industrial growth, marking a shift in trajectory.
This marked a notable decline from the robust 10.3% witnessed in the preceding month of August, signifying a trend change.
This deceleration primarily found its roots in the manufacturing sector, a pivotal pillar in India’s industrial landscape.
(India Industrial Production, MOSPI)
Manufacturing Sector: A Key Player
The heartbeat of India’s industrial landscape, the manufacturing sector, underwent a 4.5% increase in output in September 2023, showcasing a notable surge from the 2.0% growth reported in the same period last year.
However, August’s buoyant growth, boasting a 9.3% increase, contrasted starkly against September’s tempered surge, outlining a clear trajectory shift.
Dissecting Sectoral Performance
Delving deeper into the fabric of industrial domains, the mining and electricity sectors portrayed a story of their own. The mining sector witnessed a 11.5% year-on-year growth in September, a tad lower than the 12.3% observed in August.
Similarly, the growth in electricity output decelerated to 9.9% in September, down from the substantial 15.3% recorded in the preceding month.
Causal Threads: Festivals and Weather Conditions
The festive calendar, a celebrated facet of Indian culture, intertwined with adverse weather conditions, emerged as pivotal factors contributing to the substantial easing observed across sectors.
These elements, intrinsic to the social and climatic fabric of the nation, influenced the industrial output significantly.
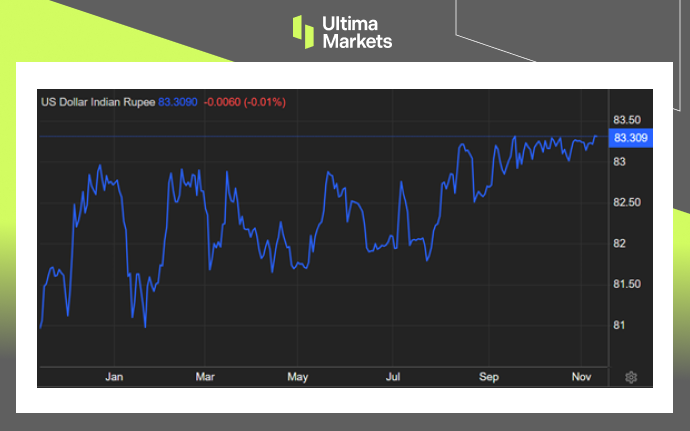
Currency Dynamics: The Tale of the Indian Rupee
Simultaneously, the Indian rupee experienced a fluctuating trajectory, edging closer to a record low against the USD.
Sustained capital outflows from the Indian economy contributed to this, prompting the Indian rupee to depreciate beyond 83 per USD in November.
The Reserve Bank of India’s proactive stance, selling foreign exchange reserves to prevent further devaluation, played a pivotal role in maintaining a delicate balance.
(USD/INR 1-year Chart)
The Reserve Bank’s Role: A Balancing Act
The RBI’s consistent sale of foreign exchange reserves, totaling over $23 billion in the past four months, illustrates the active role played in stabilizing the Indian rupee’s value.
This strategic move has curbed excessive bearish positions on the currency, sustaining a delicate equilibrium amidst global economic ripples.
Navigating the Industrial Seas Ahead
As India charts its economic trajectory, acknowledging the impact of festivals, climatic variables, and global economic dynamics remains imperative. The interplay of these elements, intertwined with the resilience and adaptability of its industrial landscape, will shape the nation’s growth story.
In conclusion, India’s industrial growth paints a narrative of resilience amidst evolving circumstances, embodying a blend of challenges and strategic maneuvering to maintain equilibrium and foster sustainable growth.
Written on November 13, 2023 at 11:46 am, by mervin
Comments Off on Understanding India’s Industrial Growth Dynamics
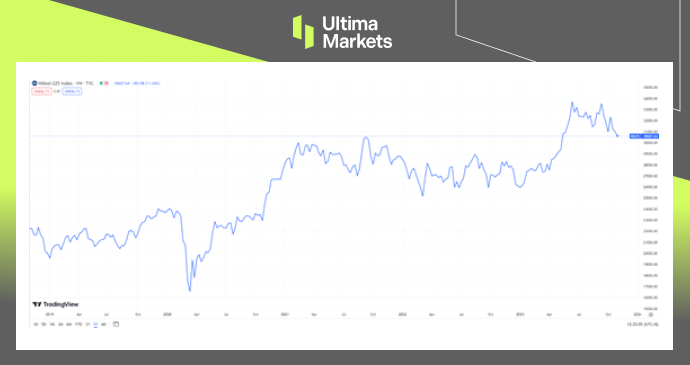
When it comes to the Japanese economy, that clichéd comment always pops up in our mind: “The Lost Decades.” Since the collapse of the bubble economy in the 1980s and 1990s, the Nikkei 225 Index has been sluggish. Especially when the COVID-19 epidemic broke out a few years ago, the Index once fell to a low of more than 16,000. Everything seems to indicate that the “lost decades” of Japan’s economy will continue.
The Nikkei 225 index, however, defied all logic by making a turnaround just after it hit bottom at the beginning of the recession. This year, on 19th of May, the Nikkei 225 index went beyond 30,800 points, achieving its highest level since 1990. That said, the Japanese stock market has kept rising ever since. It was as high as 33,000 just in June, beating most stock markets throughout the globe.
Why has the Japanese stock market, which has been in the doldrums for many years, been able to come back to life and continue to rise this year? After this round of surge, can the Nikkei 225 Index further continue its rise in the future? This article will take you to find out.
The performance of the Nikkei 225 Index in the past 5 years
The low financing cost of Japanese Yen
The exchange rate is usually crucial to a country’s stock market. For many non-U.S. currencies, once the domestic currency exchange rates against the U.S. dollar rise, the stock market prices will rise accordingly. China’s A-shares are a typical example. Once the RMB exchange rate against the U.S. dollar rises, the performance of A-share market will tend to start an upward trend. But Japan’s stock market is exactly a counterexample. In the past five years (as of the time of writing), the exchange rate of the Japanese yen against the US dollar has fallen by approximately 23.75%, but the Nikkei 225 index has increased by approximately 38%, obviously showing a negative correlation.
The reasons for this phenomenon mainly lie in two aspects:
Extremely low financing cost of Japanese Yen
Continuous inflow of foreign capital into Japan’s stock market
Since it is widely known that, following Japan’s economic bubble burst some thirty years ago, the BoJ has been engaged with slack monetary policies for quite some time in an endeavor at reviving market sentiment. It is clear that for so many years the Bank of Japan’s efforts to rehabilitate the market have gone unnoticed. However, those efforts helped to maintain Japan’s incredibly low-interest rates and finance costs. By lowering interest rates and purchasing government bonds, the Bank of Japan has effectively kept funding costs down. This means that businesses and investors can obtain funds at a lower cost, stimulating investment activity and increasing market liquidity. Low financing costs also provide companies with more room for capital returns, thus creating a basis for stock market gains.
Yet, it is no hidden secret that the Japanese yen has a very low cost of financing. This rate has been relatively low over multiple decades. So, the low financing rate by itself is definitely insufficient to justify the reason why the Nikkei 225 Index has shot up in the past few years. This leads to the second reason: the inflow of foreign capital.
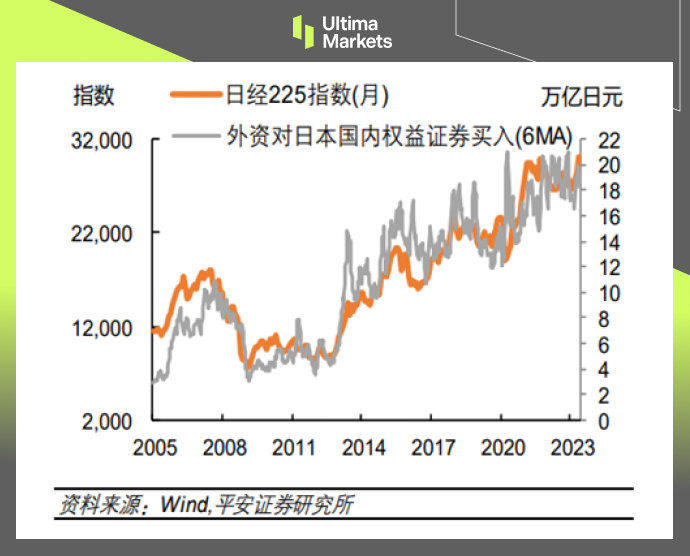
Foreign capital accounts for more than half of the trading volume in the Japanese stock market, and the flow of foreign capital has an important impact on the Japanese stock market. The internationalization of Japan’s securities market started early: Since the revision of the Foreign Exchange Law in 1980, Japan has relaxed restrictions on bond investment by non-residents; in 1989, foreign capital was allowed to set up funds for investment; in 1992, the threshold was significantly lowered further, which greatly facilitated foreign investment. Subsequently, the number and transaction volume of foreign investors continued to increase. As of 2021, the number of foreign investors in Japanese exchanges has risen to about 30%, and the trading volume of foreign investors has exceeded 60%. Since 2005, foreign investors’ purchases of Japanese domestic equity securities have shown obvious synchrony with the trend of the Nikkei 225 Index. This shows that the movement of foreign capital affects the performance of the Japanese stock market to a great extent.
The “Buffett Effect” boosts Japanese stock market valuations
The topic pertaining to foreign capital inflows should also not miss mentioning Buffett’s effect. Increasingly, foreign institutions that are associated with Buffet have improved their positions in Japan’s shares, which makes the Nikkei 225 Index grow. Already, in the opening years of the pandemic outbreak at this point (in 2020), Buffett had started buying equity shares in the country’s five leading exchange bodies. For example, during his speech in early May this year at a Berkshire Hathaway shareholder meeting, even Buffett declared these five companies to be “smart, big” and that they operate “intelligently”. Everyone knows that Buffet is a “value investor” and a long-time investor in stocks with low prices. Buffet’s value investing entails screening for highly profitable firms, reliable cash flows, solid profitability records as well as outstanding leadership. Today, though Buffet continues to put more of his investment into Japanese companies and he views this as among the markets with great prospects for investment ventures. No doubt, this has attracted more market attention and enhanced the trend in the Japanese equity market.
First of all, Buffett’s investment behavior is seen as an endorsement of Japanese companies to some extent. This will increase investors’ confidence in these Japanese-listed companies, thereby driving up stock prices.
Secondly, Buffett is led by long-term investment, and his investment behavior demonstrates his confidence in the long-term growth potential of the company. This long-term investment concept has a positive impact on encouraging investors to maintain a patient and persistent investment attitude. After seeing Buffett’s success in the Japanese market, investors also tend to adopt a longer-term investment strategy and hold stocks with more confidence, which in turn steadily promotes the rise of the stock market.
Can the Nikkei 225 Index continue its rise in the future?
Short-term funds may raise the trend for any country’s stock market in the short run, but the long-term success of a stock market depends on its fundamentals; therefore, the fundamentals of the Japanese stock market are no exception.
However, the Japanese economy has long faced a problem, that is, the existence of a large number of “zombie companies” that has hindered economic development. The so-called zombie companies refer to those companies that have stopped production, semi-stopped production, suffered losses for consecutive years, or are insolvent. They mainly rely on government subsidies and bank loan renewals to survive and operate. Since the Japanese economic bubble thirty years ago, the Bank of Japan has fueled bail-outs to a large number of companies in order to save the market, which has led to the existence of a large number of zombie companies.
On September 21 this year, Toshiba, a former symbol of Japan’s manufacturing industry and with a history of 150 years, was officially delisted. Many people believe that the collapse of Toshiba, a famous Japanese company, seems to mean that Japan’s manufacturing industry is losing its last fig leaf. But if we look at it from another perspective, we may have a completely different feeling.
Toshiba’s decline has actually been foreshadowed for a long time. As early as more than ten years ago, Toshiba’s operating income had been declining year by year. In this regard, Toshiba can only continue to “shut down departments” to survive. In 2015, Toshiba sold its image sensor business to Sony; in 2016, it sold its home appliance business to Midea; in 2017, it sold its TV business to Hisense; in 2018, it sold its computer business to Sharp; in 2022, it sold HVAC business to Carrier. It can be said that Toshiba is no longer a star representative of the Japanese economy, but is increasingly looking like a typical zombie company. If zombie companies like Toshiba can successfully delist, then for the Japanese market, it will be more like creating a new atmosphere.
This is just like investors in China’s A-shares market often complain that China’s stock market cannot usher in a bull market because of the lack of a reasonable delisting mechanism, which has led to many junk-listed companies dragging down the performance of A-shares. With Toshiba’s delisting, Japan seems to have taken a step ahead of A-shares in this regard and has begun to take the initiative to clear out zombie companies.
In addition to eliminating the remains of the old era, Japan seems to be paying more and more attention to cultivating the “unicorns” of the new era. During the “lost decades”, Japan has been criticized for its lack of innovative unicorns. As of the first quarter of this year, among the 1,026 unicorn companies in the world, Japan, the world’s third largest economy, only has six companies.
But all this seems to be changing. The past year 2022 was called the “Year of Entrepreneurship” in Japan. According to research by KPMG, Japanese startups raised a total of 877.4 billion yen in 2022, a record high. At the same time, these funds are not concentrated in traditional industries, but have poured into emerging industries such as the Internet, financial technology, new energy, and blockchain.
Driven by the new trend, Japan’s GDP in the second quarter of this year grew by as much as 6% year-on-year. Although it was later revised to 4.8%, this is still a very impressive result for a developed economy. Of course, just one-quarter GDP growth is certainly not enough to prove that the Japanese economy has completely escaped the lost decades. Moreover, such achievements are mainly achieved by relying on export growth, and Japan’s domestic personal consumption is still relatively weak. Therefore, we believe that the current Japanese economy does show some new trends, but whether it can continue in the future requires further observation to see whether Japanese citizens can be affected by these new trends, so as to increase personal consumption and investment, and whether integration of Japanese society can emerge.
Summary
• The extremely low financing cost of the Japanese yen and the continuous influx of foreign capital into the Japanese market have jointly promoted the rise of the Nikkei 225 Index.
• The “Buffett effect” further boosted Japanese stock market valuations.
• The future trend of the Nikkei 225 Index depends on Japan’s local economic and social fundamentals.
Disclaimer
Comments, news, research, analysis, price, and all information contained in the article only serve as general information for readers and do not suggest any advice. Ultima Markets has taken reasonable measures to provide up-to-date information, but cannot guarantee accuracy, and may modify without notice. Ultima Markets will not be responsible for any loss incurred due to the application of the information provided.
Written on November 13, 2023 at 9:06 am, by mervin
Comments Off on Given Japan’s Lost Decades, Why the Nikkei 225 Index Still Hit New Highs This Year?
In this comprehensive analysis, Ultima Markets brings you an insightful breakdown of the AUD/USD for 10th November 2023.
Key Takeaways
RBA raised interest rates: The Reserve Bank of Australia raised the cash rate by 25 basis points to 4.35% on Tuesday. Since the market had already expected the Reserve Bank of Australia to raise interest rates, the previous appreciation of the Australian dollar had already factored in this information. Subsequently, Bullock hinted that the obstacles to further tightening of policy have increased, causing the Australian dollar to fall.
The RBA is not strong: In fact, the market is pricing in not only an interest rate hike by the RBA in November, but also another interest rate hike in this cycle. But subsequent RBA statements failed to confirm this hawkish stance, instead taking a data-reliant approach to assessing the need for further tightening.
AUD/USD Technical Analysis
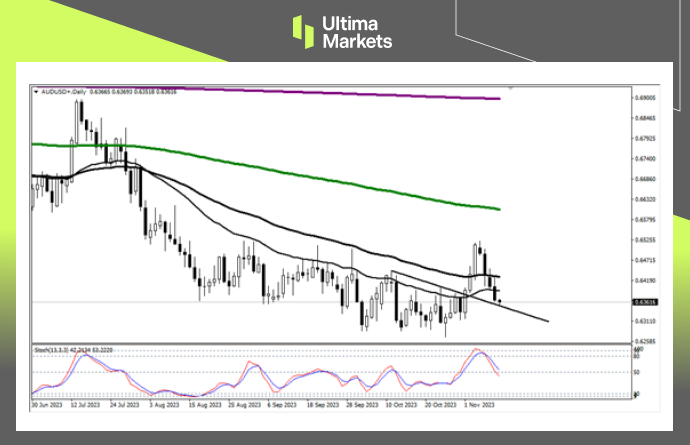
AUD/USD Daily Chart Insights
Stochastic Oscillator: After the indicator issued a short signal, it went all the way down. The short-term trend of the Australian dollar was confirmed to be depreciation. It is worth noting that it is close to the 50 mid-line, so be wary of a rebound or reversal.
Moving average combination: The exchange rate fell below the moving support formed by the 33-day and 65-day moving average combination. After the exchange rate closed below the 33-day moving average yesterday, the probability of the market continuing to decline increased.
Downward trend line: On November 1, the exchange rate broke through the downward trend line, and today it stepped back on the trend line. If there is any stop signal, the exchange rate still has the possibility of reversing upward.
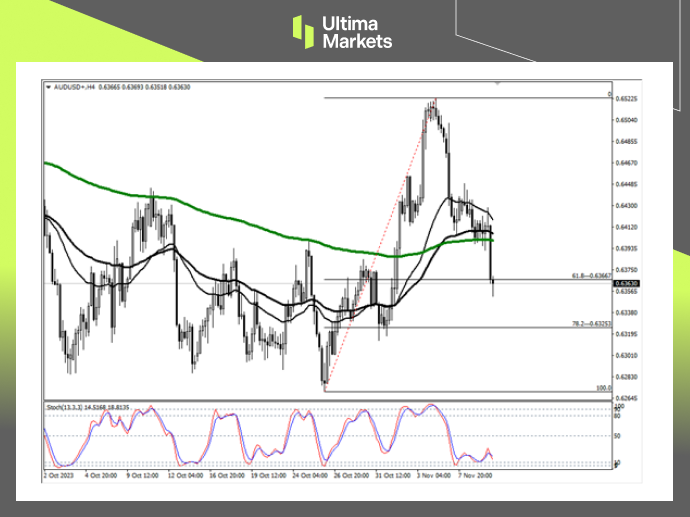
AUD/USD 4-hour Chart Analysis
Stochastic oscillator: The indicator is not currently oversold, and there is a certain bottom divergence pattern in line with the market, suggesting that the current downward space is limited, and may enter an adjustment or even rebound next.
Fibonacci retracement level: Yesterday, the exchange rate fell rapidly to the 61.8% Fibonacci retracement level. Usually, such a rapid decline close to the resistance area has a certain probability of rebound.
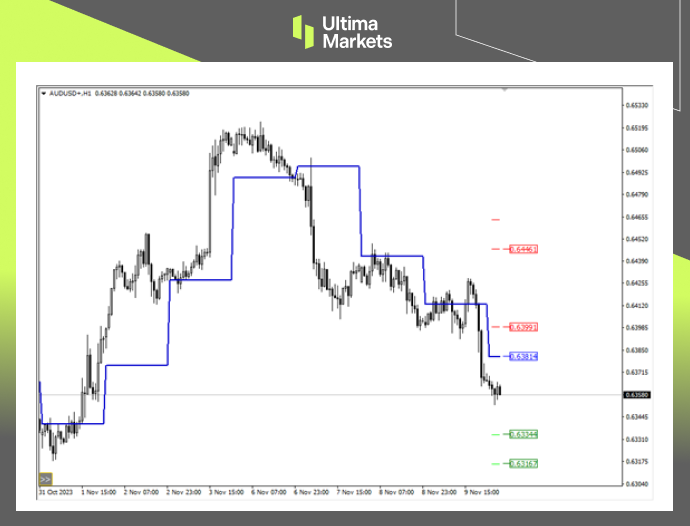
Ultima Markets MT4 Pivot Indicator
According to the pivot indicator in Ultima Markets MT4, the central price of the day is established at 0.63814,
Bullish Scenario: Bullish sentiment prevails above 0.63814, first target 0.63991, second target 0.64461;
Bearish Outlook: In a bearish scenario below 0.63814, first target 0.63344, second target 0.63167.
Conclusion
Written on November 10, 2023 at 2:31 pm, by mervin
Comments Off on Focus on AUD/USD Today – 10th November 2023