
Ultima Markets App
Trade Anytime, Anywhere
Important Information
This website is managed by Ultima Markets’ international entities, and it’s important to emphasise that they are not subject to regulation by the FCA in the UK. Therefore, you must understand that you will not have the FCA’s protection when investing through this website – for example:
- You will not be guaranteed Negative Balance Protection
- You will not be protected by FCA’s leverage restrictions
- You will not have the right to settle disputes via the Financial Ombudsman Service (FOS)
- You will not be protected by Financial Services Compensation Scheme (FSCS)
- Any monies deposited will not be afforded the protection required under the FCA Client Assets Sourcebook. The level of protection for your funds will be determined by the regulations of the relevant local regulator.
Note: Ultima Markets is currently developing a dedicated website for UK clients and expects to onboard UK clients under FCA regulations in 2026.
If you would like to proceed and visit this website, you acknowledge and confirm the following:
- 1.The website is owned by Ultima Markets’ international entities and not by Ultima Markets UK Ltd, which is regulated by the FCA.
- 2.Ultima Markets Limited, or any of the Ultima Markets international entities, are neither based in the UK nor licensed by the FCA.
- 3.You are accessing the website at your own initiative and have not been solicited by Ultima Markets Limited in any way.
- 4.Investing through this website does not grant you the protections provided by the FCA.
- 5.Should you choose to invest through this website or with any of the international Ultima Markets entities, you will be subject to the rules and regulations of the relevant international regulatory authorities, not the FCA.
Ultima Markets wants to make it clear that we are duly licensed and authorised to offer the services and financial derivative products listed on our website. Individuals accessing this website and registering a trading account do so entirely of their own volition and without prior solicitation.
By confirming your decision to proceed with entering the website, you hereby affirm that this decision was solely initiated by you, and no solicitation has been made by any Ultima Markets entity.
I confirm my intention to proceed and enter this website Please direct me to the website operated by Ultima Markets , regulated by the FCA in the United Kingdom

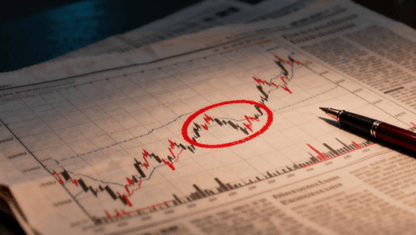
价量表怎么看?从价量关系轻松掌握股票买卖关键信号
在股票的技术分析世界里,K线的红绿翻飞总是最先抓住投资人的目光。
然而,许多陷入追高杀低困境的投资者,往往忽略了藏在价格图下方、真正驱动趋势的引擎——“成交量”。
学会价量表怎么看,是判读市场真实意图、提升交易胜率的关键第一步。

价量表怎么看的基础:价格与成交量各代表什么?
在学习价量表怎么看之前需了解什么是价量表。
简单来说,价量表就是将市场的“成绩单”(价格)与“努力程度”(成交量)并列在同一张图上,让我们能综合判断趋势的健康状况。
- 价格(价):位于图表上方,通常以K线(蜡烛图)呈现。它告诉我们在特定时间(如一天)内,股价的开盘、最高、最低和收盘价,是市场多空博弈的结果。
- 成交量(量):位于图表下方,以一根根的柱状图表示。它记录了该期间内总共成交的股数或张数,代表了市场的参与热情和资金动能。
学会价量表怎么看的核心理念是“量是价的先行指标”。

如何快速掌握价量表怎么看?
要快速理解价量关系,可以从股价涨跌与成交量增减的四种组合入手。下表将展示这些型态的特征以及它们在市场上的解读:
| 形态 | 特征 | 市场解读 |
| 价涨量增 | 股价上涨,成交量同步放大 | 健康的多头讯号,买盘积极,后市看涨几率高。 |
| 价涨量缩 | 股价上涨,成交量反而萎缩 | 上涨动能减弱,追价意愿不足,属“量价背离”,需警惕反转。 |
| 价跌量缩 | 股价下跌,成交量异常放大 | 典型的空头讯号,市场恐慌性卖压涌现,后市看跌几率高 |
| 价跌量缩 | 股价下跌,成交量逐渐减少 | 卖压趋缓,杀低意愿降低,可能接近底部,可留意止跌讯号。 |
位置决定一切
同样是“价跌量缩”,出现在股价涨幅已大的高位,可能是主力出货尾声;但若出现在长期下跌的低位,则可能是底部征兆。

透过K线与量能,价量表的进阶买卖讯号该怎么看?
在市场转折点上,主力资金的动作会特别明显,因此结合K线形态与量能,更能抓到关键信号:
- 高位放量长阴线:股价经历一段涨幅后,在相对高点突然出现巨大成交量并收长阴线,这通常是主力出货的迹象,应视为卖出警讯。
- 低位放量长阳线:股价在长期下跌后,于相对低点爆出大量并收长红K线,可能是主力开始进场吸纳筹码,趋势有望反转向上。

结语
综合来看,学会价量表怎么看,是投资新手迈向成熟的重要一课。它帮助投资者洞悉市场资金动能,从而更冷静地判断行情。
在正式投入资金前,建议先透过模拟账户测试不同情境,逐步建立交易直觉;待熟练后,再利用 立即开设真实账户,把策略落地到市场。
FAQ
Q:成交量柱的颜色有什么意义?
A:它通常与当日K线颜色同步。收红K(收盘 > 开盘)时,量能柱为红色,代表当日买方主导;收黑K(收盘 < 开盘)时为绿色,代表卖方主导。
Q:出现“量价背离”后,我该马上反向操作吗?
A:不建议。量价背离是一个“预警信号”,而非“行动指令”。它告诉你当前趋势的动能正在减弱,但不代表会立刻反转。市场可能进入盘整或以缓慢的速度继续原趋势(称为背离后的背离)。
Q:除了看单日量能,还有更客观的判断方法吗?
A:有的,强烈建议使用“成交量移动平均线”(通常设5日或20日)。当日的成交量柱若明显高于均量线,才是有效的“放量”;反之则是“缩量”。
。免责声明:本内容仅作为参考信息,不能视为任何形式的金融、投资或专业建议。文中观点不代表 Ultima Markets 或作者对任何特定投资产品、策略或交易的推荐。请勿仅依据本资料作出投资决策,必要时请咨询独立专业顾问。
最新文章


Ultima Markets 为金融委员会 (The Financial Commission) 会员。金融委员会是一个独立的外部争端解决组织,专门解决外汇市场的争议和投诉。
Ultima Markets 所有客户皆纳入 Willis Towers Watson (WTW) 保险保障,每帐户赔偿金额最高可达 100万美元,WTW 是一家成立于 1828 年的保险经纪公司,服务遍及全球。
Ultima Markets是第一个加入联合国全球契约组织的差价合约经纪商。
与我们进行交易
风险披露
风险提示:
杠杆类金融产品(包括差价合约)具有高风险,交易可能导致亏损超过您的初始投入。该类产品并不适合所有投资者,请确保仅使用可承受损失的资金进行交易。差价合约交易并不代表您拥有相关标的资产(例如:股息权益等)。请务必充分了解相关风险,并根据自身的投资经验和目标,谨慎判断是否适合参与交易。如有需要,建议寻求独立的财务顾问意见。所有交易决策前,请仔细阅读我们的法律文件及风险披露。
一般性建议声明:
本网站所提供的信息仅为一般参考,未针对您的个人投资目标、财务状况或具体需求作出个别化建议。请在采取任何投资行动前,充分评估其是否适合自身情况,并仔细查阅我们的法律文件。
地区限制说明:
本网站的相关信息与服务并不适用于部分地区用户,包括但不限于美国、英国、新加坡及受国际制裁的地区。如需了解更多详情,请联系客户服务团队。
监管信息:
Ultima Markets是多个在不同司法辖区运营的实体共用的交易品牌。下列实体均获正式授权,使用 Ultima Markets 品牌及商标开展业务。
-
Ultima Markets UK Limited(参考编号 470325)已获英国金融行为监管局(FCA)授权并受其监管。注册地址:英国伦敦 E1 6RS,Blossom Yard 1号,四楼。
-
Ultima Markets Ltd 持有模里西斯金融服务委员会(FSC)颁发的全牌照投资商执照(不含包销业务),牌照编号为 GB 23201593。
注册地址:2nd Floor, The Catalyst, 40 Silicon Avenue, Ebene Cybercity, 72201, Mauritius。
版权声明 © 2026 Ultima Markets Ltd.保留所有权利。
-

Messenger


Continue on Messenger
Take the conversation to your Messenger account. You can return anytime.
Scan the QR code and then send the message that appears in your Messenger.
Open Messenger on this device.
-

Instagram

Continue on Instagram
Take the conversation to your Instagram account. You can return anytime.
Scan the QR code to open Instagram. Follow @ultima_markets to send a DM.
Open Instagram on this device.
-

Live Chat
-
